Recently, I’ve sucessfully tested the new driver ciruit for my ultrasonic anemometer. It performed even better than I expected and I will be happy to use it pretty much as it is.
By the way: If you want to get an overview over how this project has developed over time check out the overview page. If you’re more interested in my latest design, this link will take to my new attempt.
So we have a circuit that can send powerful ultrasonic pulses from the right transducer, receive the signal from the opposite transducer and route it through an amplifier. The next task is to tell the time-of-flight from the received signal. A contemporary approach would probably involve some sort of DSP and software. My last approach used some analog circuitery to detect the zero crossings as well as the envelope of the received signal. Since most of the heavy lifting was done in hardware, a simple 8-bit microcontroller like the one on the Arduino UNO could be used to do the measurements.
For my new approach I haven’t quite decided which route to take. To me they both have a certain appeal. And over the last year or so I’ve had quite some ideas on how to process the signal in hardware so I’ll give it a try and see how it works out. In this post I’ll go through this new circuit and explain how it works (or is supposed to work) step-by-step.
The zero crossing detector (ZCD) is almost identical to to my last design. The amplifier output is biased to half the positive supply voltage and fed into a fast comparator (Microchip MCP6561R). On the comparator’s output we get a precise digital signal indicating if we are currently looking at the positive or negative half-wave. Right at the logic edge we observe a zero crossing which can then be used to very precisely determine the phase shift relative to the transmitted singal.
The more challenging part is to tell the absolute phase – this is where my last project was only partly successful. It used an active low-pass filter to get the envelope of the received singal. This envelope was then compared to some threshold and the time from the transmition of the singal to when the envelope exceeded the threshold was measured. With plenty of averaging this gave a usable but far from perfect indication of absolute phase. So this time I’ll try something entirely new.
The amplified singal is first run trough an active full-wave rectifier as found on page 257 of Horowitz and Hill’s 3rd edition of Art of Electronics. It uses two op amps as well as some resistors and diodes to produce a singal that corresponds to the absolute value of its input. The two op amps come in a single package. It’s the same type as for the amplification stage of the driver circuit – a Texas LMC6482.
Now the rest of the circuit is a bit more adventurous. It attempts to produce a signal that corresponds to the peak of the previous half-wave. So it is steady during each halv-wave period and should give a (hopefully precise) indication of the amplitude of the received signal. This singal can then sampled by an ADC at 80kHz triggered by the zero crossing detector. 80kHz is not that fast for a (say) 10-bit ADC and definitely much slower than what we’d need if we sampled the amplified signal directly.
The advantage of measuring the amplitude is the following: We can find the peak of the amplitude in simple software and use the time when the peak occured to find the absolute phase. So we are no longer dependant on the absolute amplitude (as we were with the envelope detector approach) but only care about when the peak in amplitude occured. I think (hope) this is a much more reliable approach.
In order to find the peak of each half-wave I use a pair of simple diode-plus-capacitor peak detectors. One is held stable (“hold”) and fed through an op-amp buffer to minimize droop while the other is looking for the next peak (“sample”). At the beginning of the sample period the capacitor is discharged through a n-channel mosfet that is turned on for just an instance.
The whole mechanism is controlled by the output of the zero-crossing detector so absolutely no software intervention is needed to produce it. The microcontroller can just wait for the ZCD to trigger an interrupt (as before) and take a sample of the output.
The circuit is not that complex and used an inexpensive and readily available 74HC4053 multiplexer at its center. I don’t have any idea yet how this thing will perform but I must say this little circuit was a lot of fun to design.
Until my next post I will have built and tested this cuircuit and will let you know how it performs. Until then I leave you with the eagle files as well as PDFs of the schematic and layout as a zip file.
Here’s how the final circuit looks and how it performs: Part 19.
I’m currently mainly working on my new anemometer design but once in a while I get distracted. For example when my Keysight E3645A lab power supply was making so much noise that I could hardly concentrate. That’s when the idea of this fan controller was born.
Of course, the best temperature controlled fan in the world doesn’t help if you really need the cooling the fan is providing. But very often a small fraction of the cooling would do just fine most of the time. In my case the supply does control the speed of the fan. But it doesn’t seem to measure the temperature at all but seems to calculate the necessary cooling in a worst-case condition. An for a supply that may be rack-mounted together with lots of other heat dissipating gear the worst-case might be quite demanding. But my supply just sits on a shelf at, say, 22 degrees ambiant. And most of the time I’m hardly pulling any current. When working with microcontroller designs it’s rare for me to pull more than a few tens of milliamps. So little cooling is needed most of the time. But the E3645A (this one here does a better job) ran its fan at crazy speeds while the case still had this cold metallic feel to it. So we can definitely do better.
So the first step was to open the supply and to see what kind of fan it uses and how it is controlled. After beaking some seals and opening the case I found a 60x60x25mm 12V fan of Chinese origin. I also found out that the supply uses linear control. So there’s no PWM or anything but the supply voltage just varies in (I think) four steps from 7.4 to 12 volts. Most surprisingly, this voltage is not ground-referenced but symmetric around ground, i.e. plus/minus 6 volts.
I was pleased to see that the fan connects to the main board by means of a standard two-pin 100mil header. So I could just plug anything in between the board and the fan.
That’s exactly what my first idea was. Stick with the original fan and just put a PWM controller in between. I’ve just recently made some LED dimmers and the technology needed here seemed to be very similar. So Rev A of my fan controller was born.
It’s simple: A linear 5V regulator, a PIC16F18325 microcontroller, an LMT86 temperature sensor and a N-channel mosfet. The PIC chosen here runs at up to 32MHz on an internal oscillator, has an internal voltage reference (of 1.024, 2.048 or 4.096V), six PWM modules and plenty of other nice features while comming in a small 14-pin package. So all I need to do is to measure the temperature, calculate the desired fan speed and set the PWM duty cycle accordingly.
My first surprise came when I first wanted to program the PIC. My trusted Mikroelectronika MikroC for PIC compiler doesn’t know that chip. And neither does my MikroProg programmer. So after a little bit of research I ordered a PICkit3 and downloaded the MPLAB IDE. As a nice side effect I can now also compile code for and program the fancier PICs like the DSPics and PIC32s. I might do that before long.
So I did the necessary programming (and debugging) and attached a small fan. It all worked but I had to chose a quite low PWM frequency in order to make the fan spin at lower duty cycles. And probably as a result of the low PWM frequency the motion of the fan didn’t look or sound very smooth.
With the larger fan from the supply things only got worse. I had to lower the PWM frequency even more into the tens of Hz range so it would spin at all. And even like this I couldn’t get it to run at low duty cycles. Of course, the low frequency caused nasty vibrations so I gave up on this approach. I read online that other people successfully use PWM on their fans but at least this model wasn’t happy to be PWM-dimmed. Does anybody know more about this? Was this an option in the old days before brushless motors were the norm? Is it that brushless motors aren’t unsuitable for this kind of control alltogether or does it depend on the specific model? Please use the comments section below if you can shead some light on this.
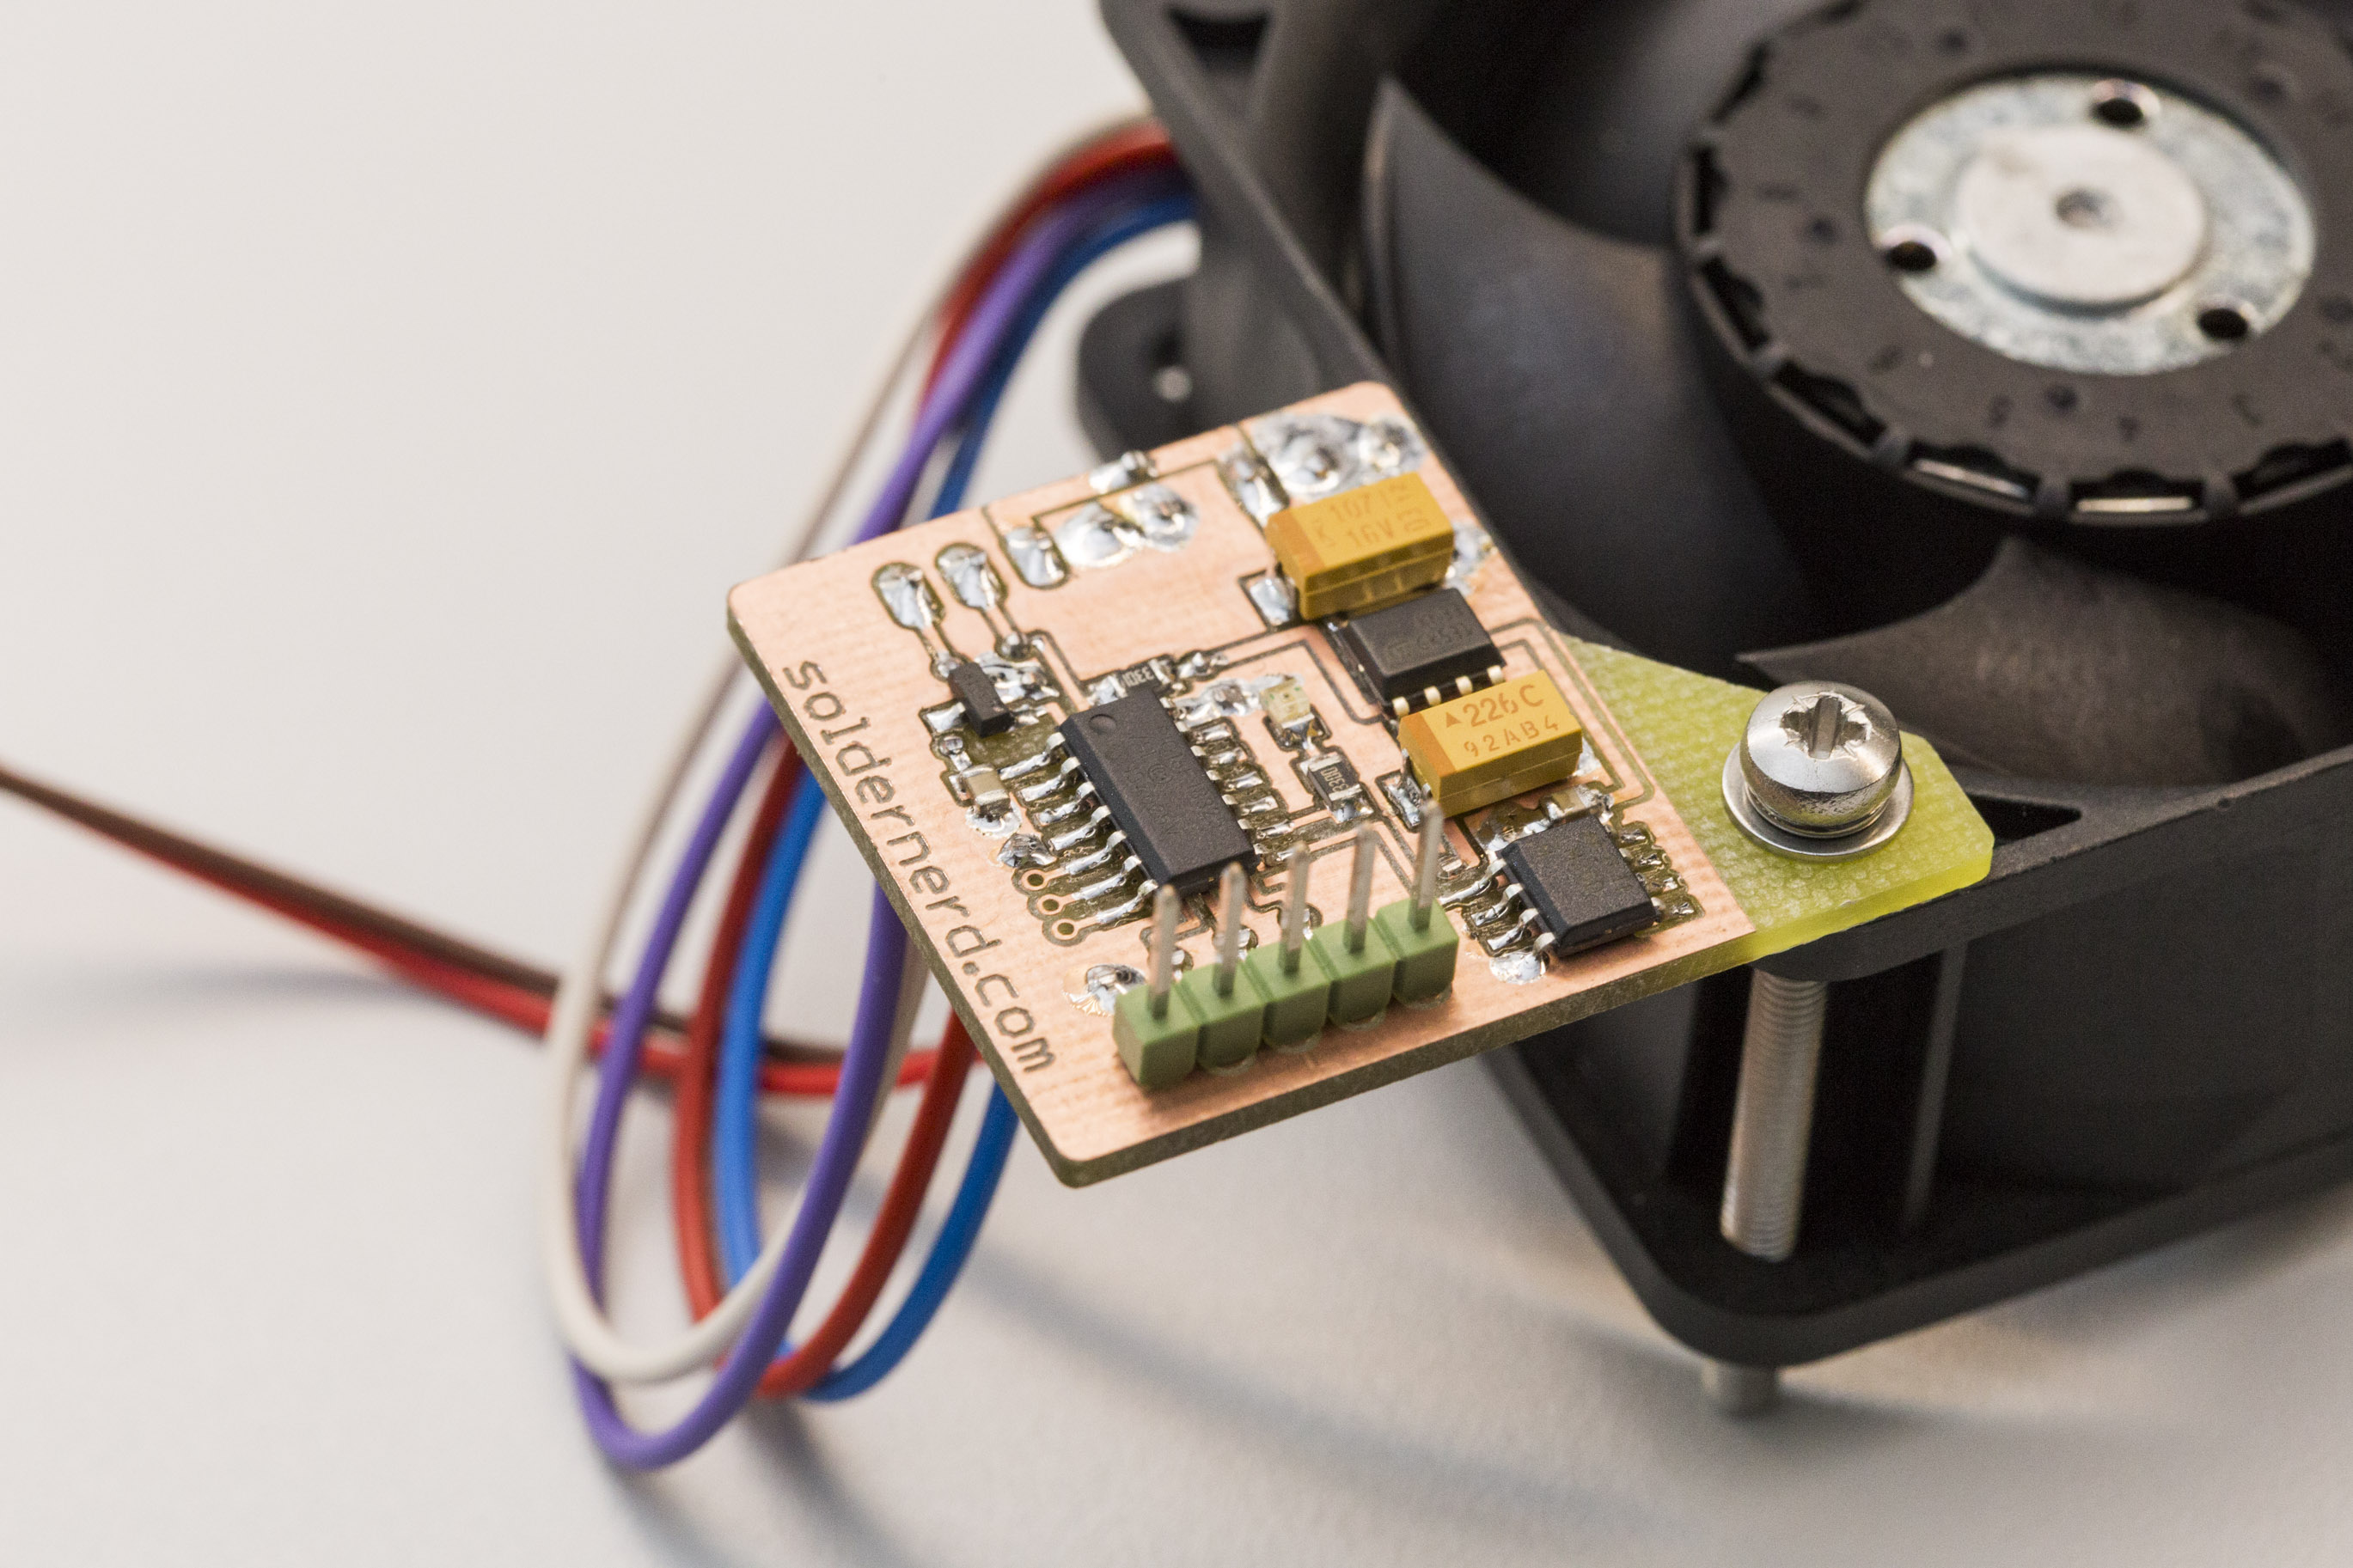
But I don’t give up easily so after a bit of research I ordered a four-wire fan conforming to the so-called Intel spec. Besides ground and +12V they have two control lines. A PWM line that lets you control the fan speed by means of a (25kHz nominally) PWM singal. And a so-called TACH singal that allows you to read the current fan speed. The PWM line has internal pull-ups to (depending on the fan) 3.3 or 5 volts so you just need to pull it low. The TACH signal needs an external pull-up resistor and gets pulled low by the fan twice per revolution. So you’re getting a digital signal with a frequency of twice the fan speed.
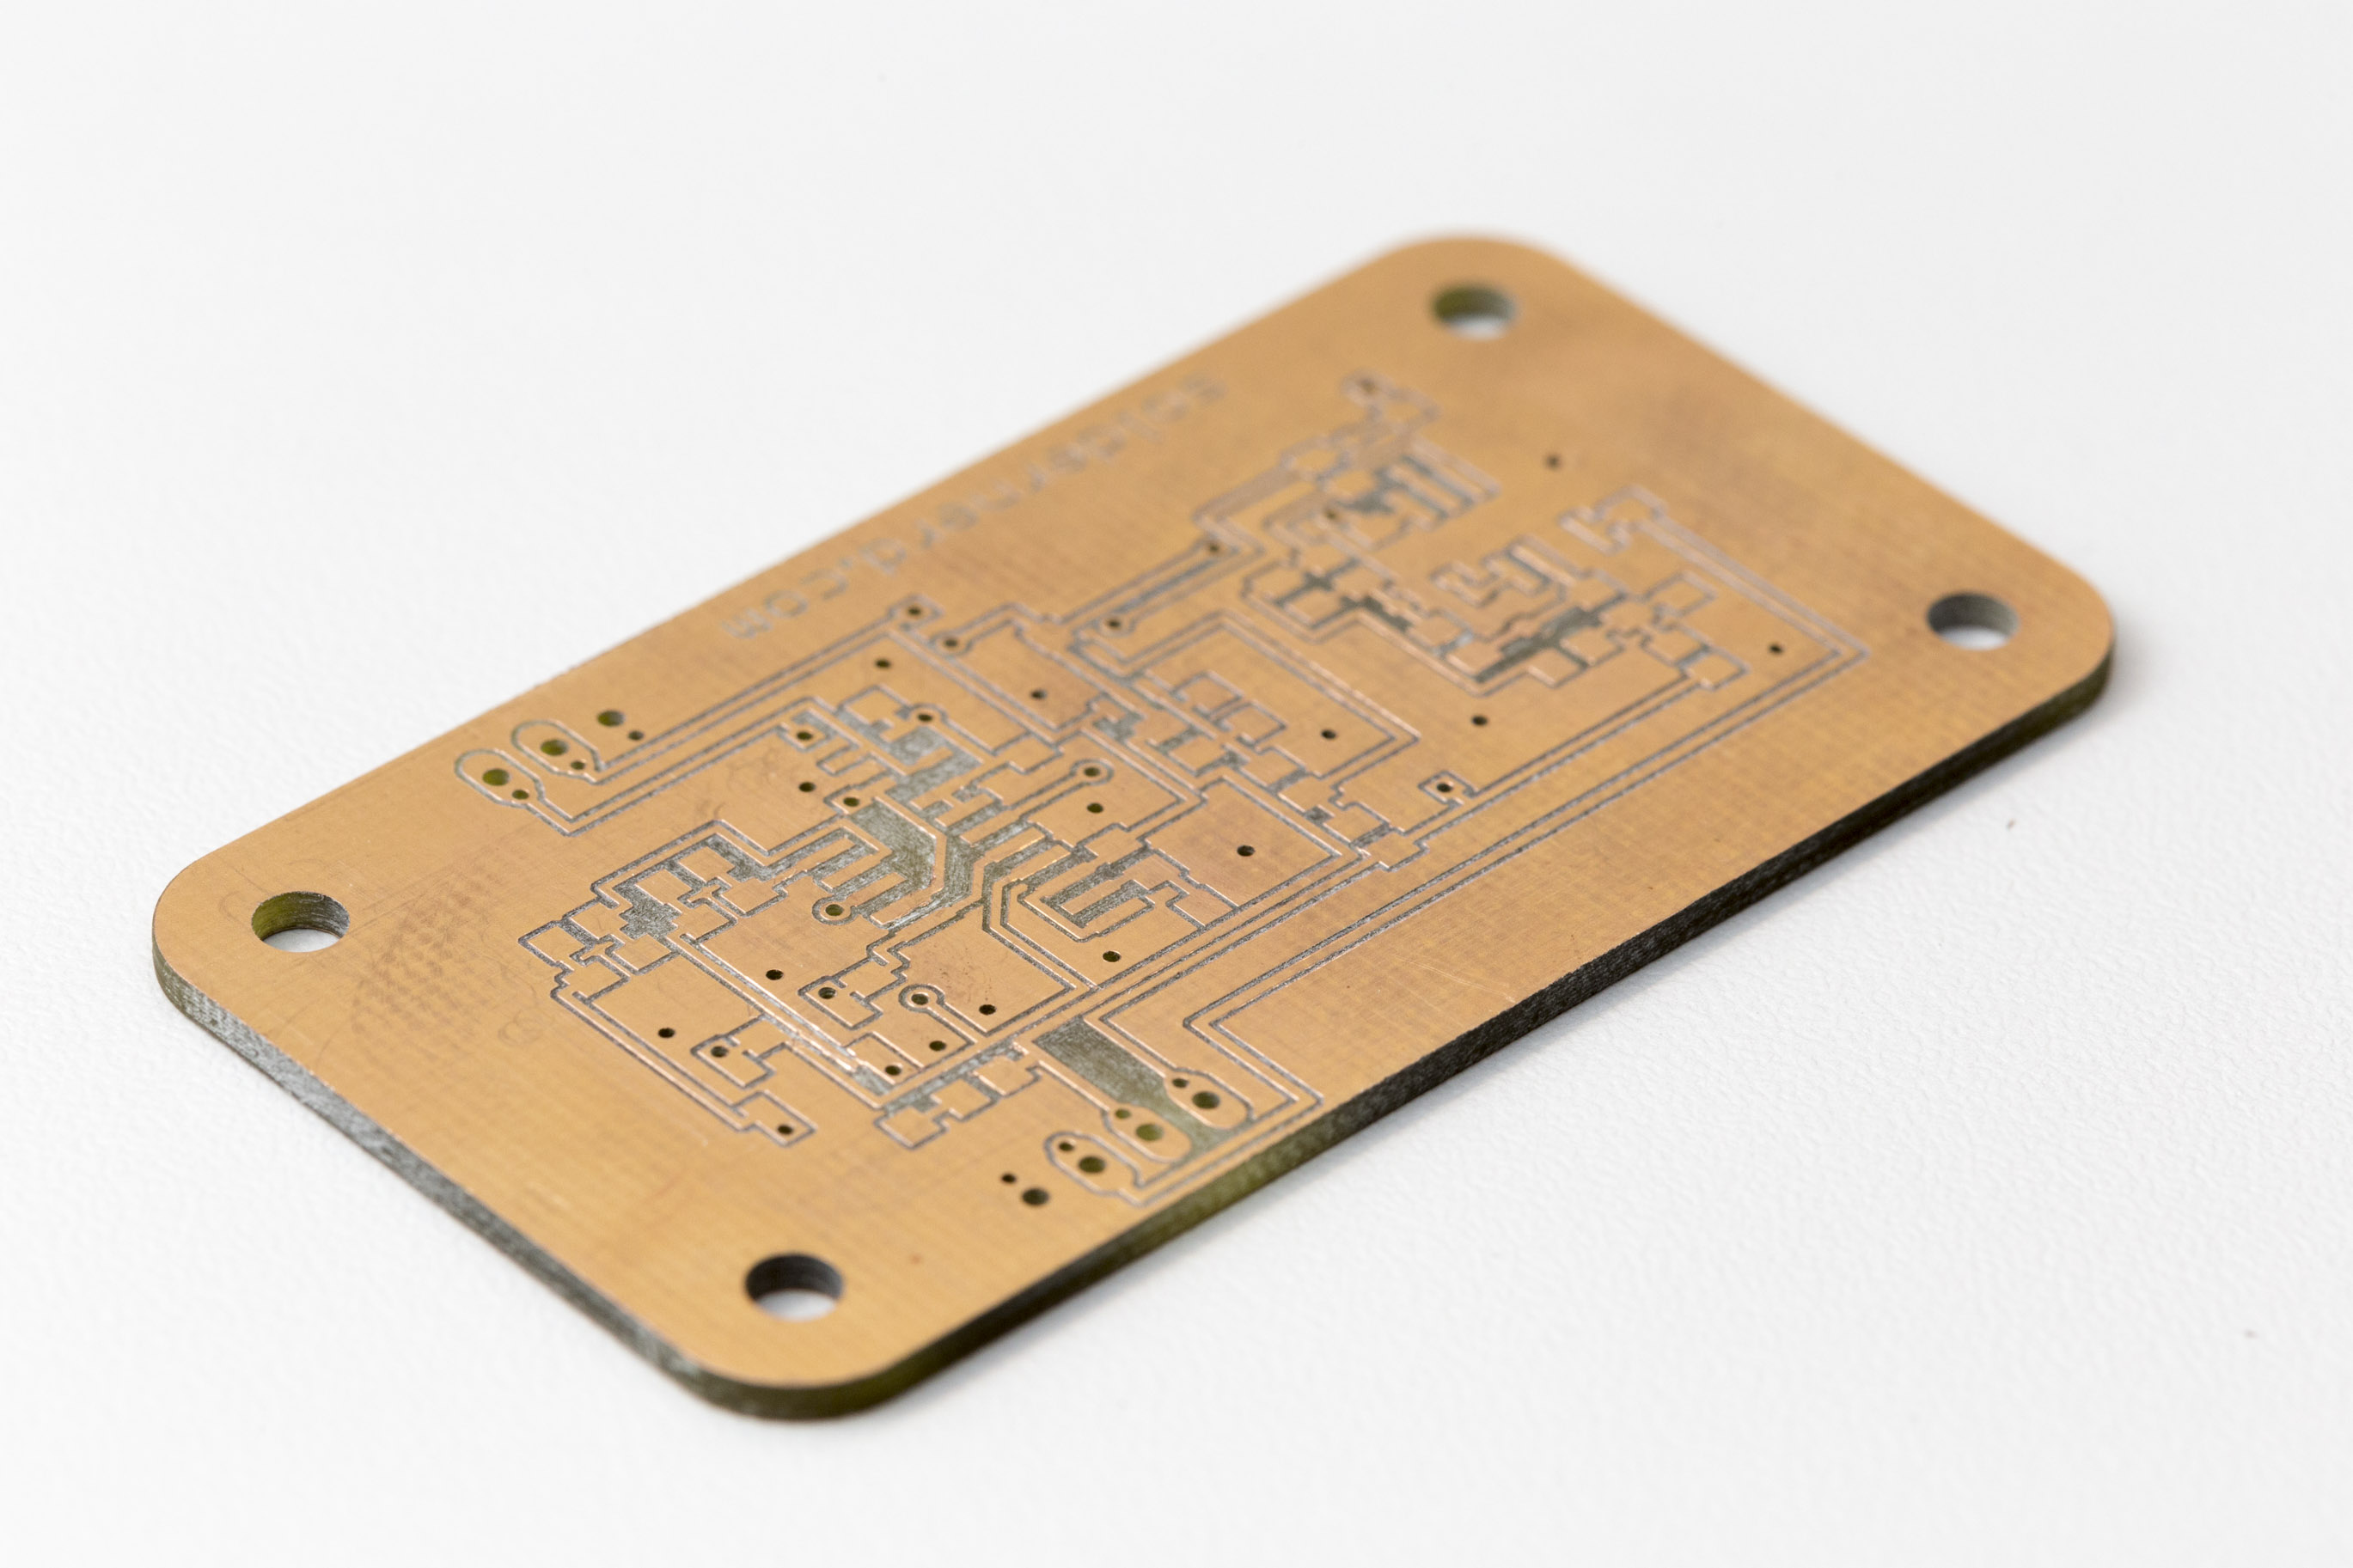
I ordered a EBM Papst 622/2 HHP which is the right size and somewhat more powerful than the original fan. The new board has a somewhat odd shape so I can use one of the fan’s mounting screws to mount the board as well. Note that all the copper has been removed around the mounting hole. The fan is attached to a heat sink which is grounded while our board runs on a split suply. So ground as our board sees it is not actually ground but a negative voltage so we have to be careful.
The new Rev B design runs on 3.3 volts in order to be compatible with any fan independent of the fan’s internal logic voltage. I’ve also used a different temperature sensor – a classic LM35.
Like the Rev A there is an LED to visually indicate what’s going on. There are also three pins on the microcontroller that are intended to be used as debug pins so I put some vias there to make it easy to connect a scope probe.
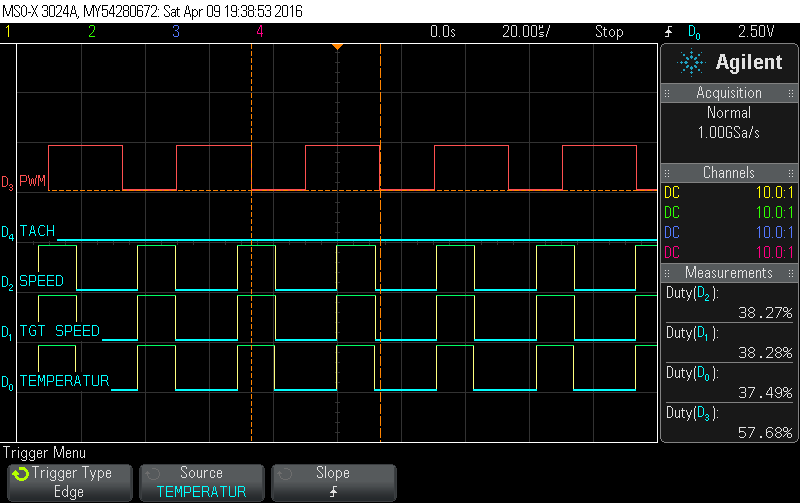
Above you get an idea of what the TACH signal looks like. It’s a quite low frequency singal since there are only two pulses per rotation. So the measured 104Hz shown on the screenshot correspond to 3120 RPM.
Having a TACH signal to measure and three debug outputs to worry about made the software development somewhat more involved but it was well worth it. I’ve used the debug pins as follows:
Actual (i.e. mesured) fan speed. 100% corresponds to 10000RPM
Target fan speed. 100% corresponds to 10000RPM
Measured temperature. 100% corresponds to 100 degrees centigrade
So from the duty cycle measured by a scope you can easily read the speeds and temperature.
Of course this is only possible since there are some unused PWM modules left. But as I said, this PIC has 6 of them and only two are needed to measure the fan speed and another to control the fan.
The transfer function from temperature to fan speed can be freely defined in software. In the screenshots above the fan was running at 1500RPM up to a temperature of 30 degrees. Above that the speed would rise linearly until reaching its maximum of 9000RPM at a temperature of 55 degrees.
One could easily implement a PID control if one was so inclined but the slowly chaning nature of the temperature in such a setting makes this largely unnecessary so at least for now only the proportional part is taken into consideration when calculating the PWM frequency.
As you can see, the little board is nicely held in place by one of the fan mouning screws. By the way, the LED blinks roughtly once per second and its duty cycle corresponds to the target fan speed relative to the maximum fan speed of 9000RPM. So if the LED is on one-third of the time the target fan speed is one-third of the maximum speed or 3000RPM.
Unfortunately for my application, the supply senses the current consumed by the fan and shuts down if not enough current flows. This is probably a good idea and prevents the supply from possible damage if the fan is unplugged for example.
I found that it is possible to run the fan at a lower speed without the supply complaining but with fan speeds below about 4000RPM the there were conditions causing an error condition. So I ended up connecting a 1W 150ohms resistor in parallel to keep the supply happy even with the fan running at only 1500RPM.
I believe that my settings are very much on the safe side. At a a temperature of around 50 degrees measured inside the case the airflow matches the one of the original fan at max speed. But needless to say this kind of fiddling voids the warranty and is always done a one’s own risk. The reward is a supply that is now hardly audible and much more pleasant to use.
The zip file contains the eagle files, PDFs and software of both revisions.
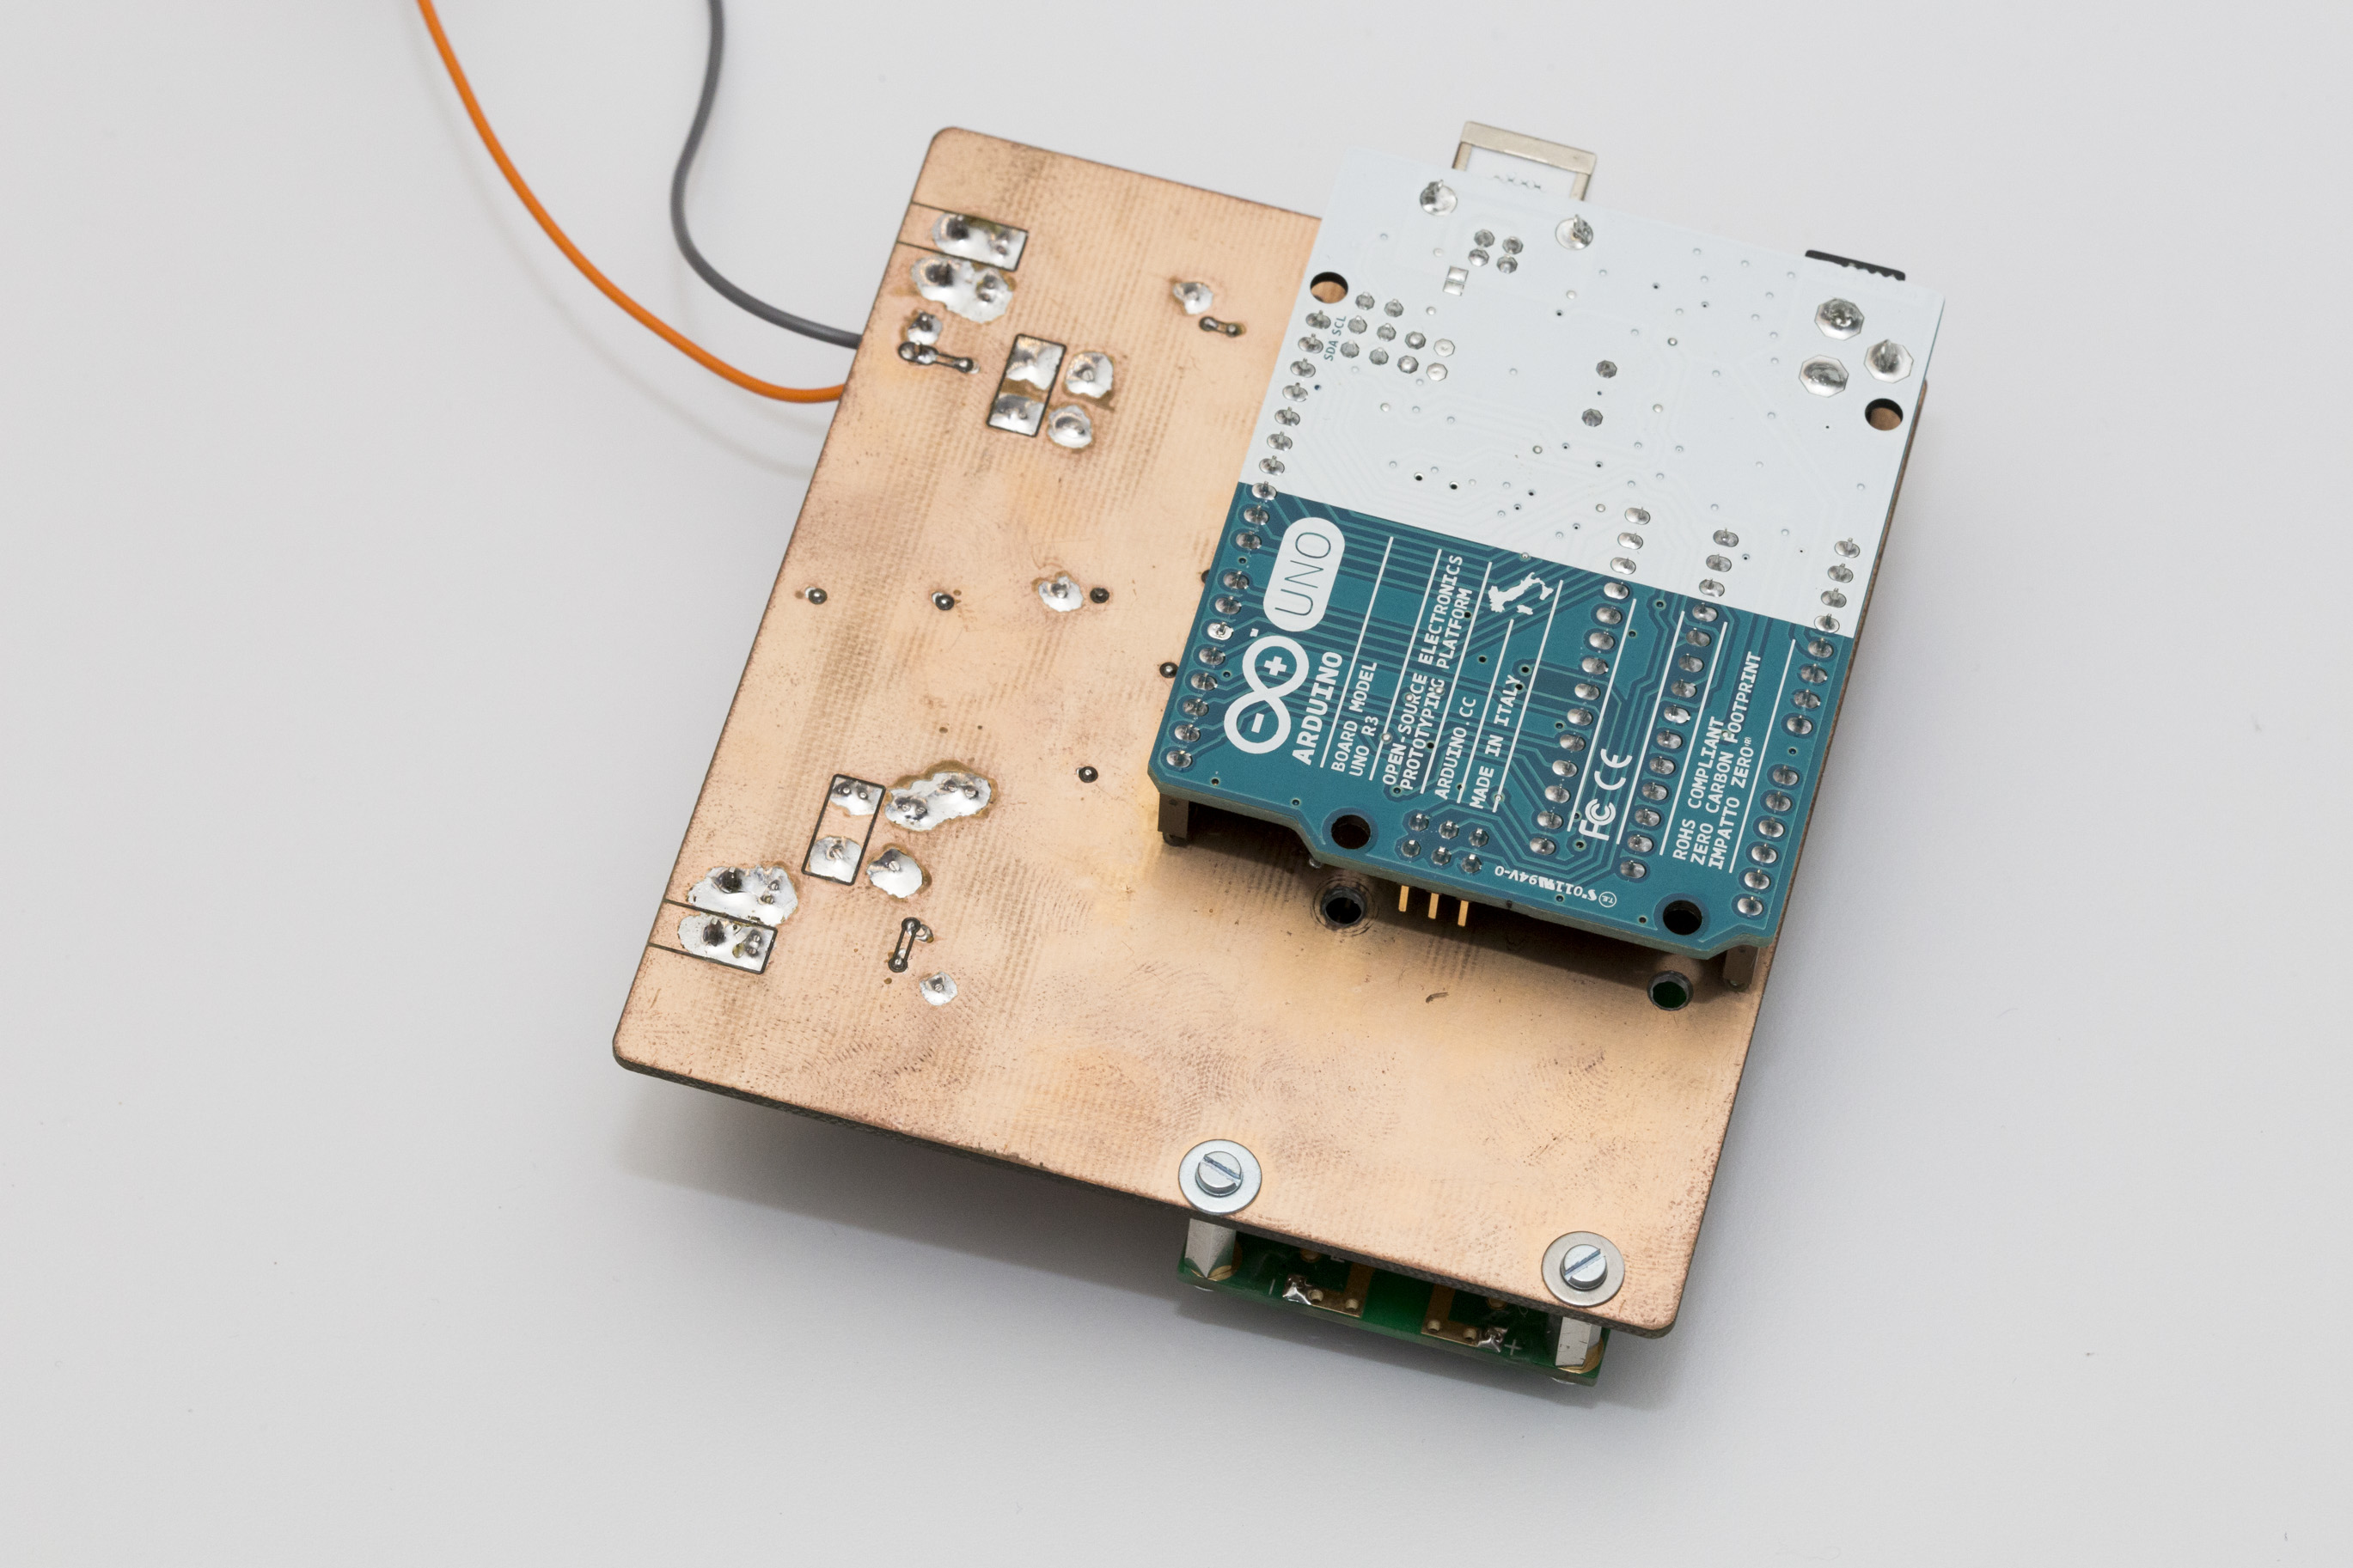
It’s been about one and a half years since I started out with my ultrasonic anemometer project. Like others before me I had to notice that this a much more demanding project than it appears to be at first. After countless hours of development and testing I have built this Arduino shield. It worked but the reliability of the measurements was never what I had aimed for. The problem was mainly how to figure out the absolute phase of the received signal. So the measurements were always precise – but sometimes off by a full wavelength. Then I was more or less inactive for most of 2015, mainly due to personal reasons. So the project was kind of stuck but i kept (and keep) getting a lot of encouraging feedback from you folks. I came up with new circuit ideas and decided to pretty much start with an entirely new design and to re-think each and every design choice I had made back then.
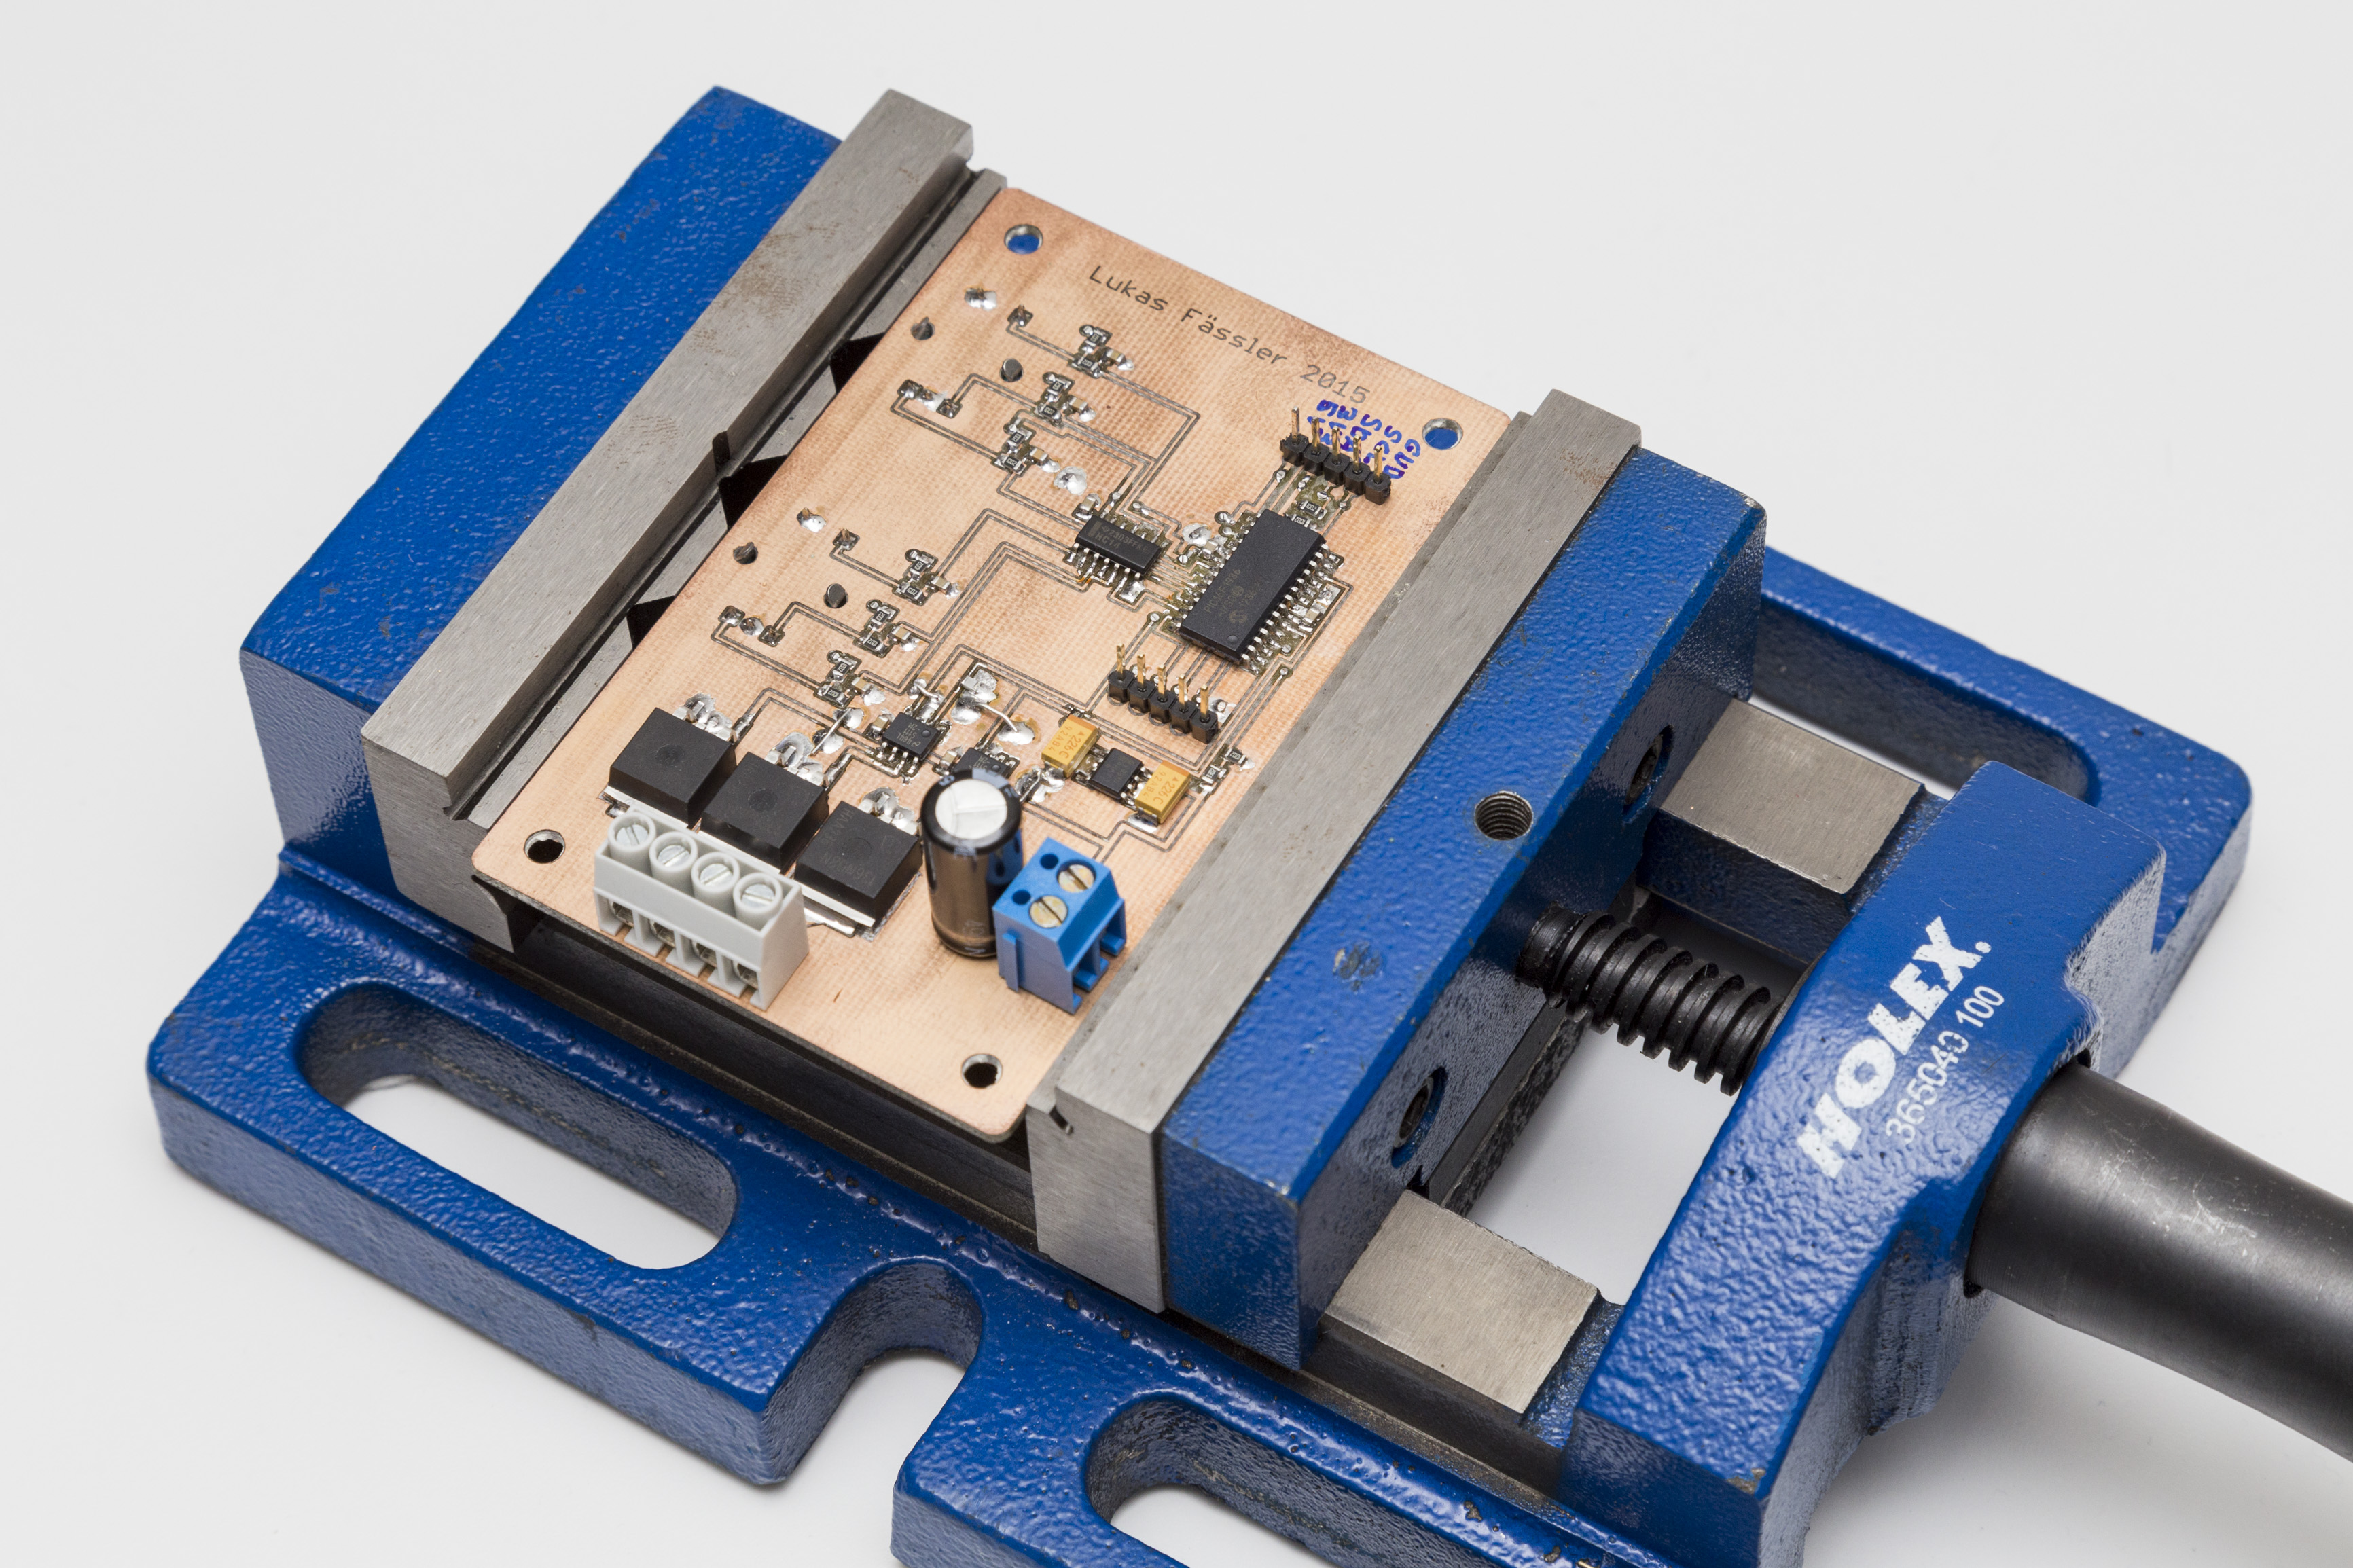
I will now outline and explain my new design for the send/receive circuit. So the board we are looking at today will handle the signal routing from the microcontroller to the individual transducers and from the transducers back to the amplifier where it is cleaned-up and amplified. There’s the circuit explained step by step.
Powerful 12V drive
My last design drove the transducers from a 74HC126 line driver / buffer. This chip has tri-state outputs which made it easy to switch to receive mode by releasing the respective transducer. It also has a strong (for a logic IC) output drive of up to 125mA to switch the capacitive load that the ultrasonic transducers present.
Unfortunately, the drivers only provided a 5V amplitude. Even worse, a more contemporary design would probably operate from a voltage of only 3.3 volts potentially making things worse in the future. So I decided to use a pair of Texas Instrument LM5111 Mosfet drivers. They can handle up to 18 volts so I can run them at a 12 volt input voltage directly. Mostet drivers are designed to drive large capacitative loads so they typically have powerful outputs. Specifically, the LM5111 can sink and source 5 and 3 amps, respectively. Thats more than any logic chip could ever provide. They also share a industry standard pin-out so they are easy to replace should the LM5111 not be readily available from your preferred supplier.
Discrete Mosfet Switches
The downside of using a Mosfet driver is that they lack the handy tri-state output. So I had to find another way to release the transducers for receive mode. Readily available integrated switches and multiplexers don’t have the low Rds-on that we need here. And they are definitely not happy if you’re trying to pass 5 amps through them. So I decided to use a discrete p-channel Mosfet for each transducer. With the gate at -5V the Mosfets conduct in the 0 to 12V range of the driving signal with a on-resistance of far below 1 ohm. So the strong drive of the LM5111 is not forfeited. With the gate at +5V the Mosfet is not conductive for signals a few volts around ground. So the receiving transducer can swing freely, unaffected by the LM5111.
Op-Amp Amplifier and Filter
The last design used a tuned two-stage common emitter amplifier. I found the design quite beautiful with nice biasing and everything but there were severe drawbacks. Mainly, the LC tank had to be tuned carefully to have it’s center frequency at 40kHz. Coils especially have large tolerances, plus/minus 20% is quite typical. This makes it at least difficult to produce any quantity of these things efficiently. It also takes some test equipment to see if your resonant frequency is correct so the design is not really suitable if you want to distribute it as a kit.
So this design uses a dual op amp at its center. I’ve decided to use a Texas Instrument LMC6482. This is an affordable precision OpAmp with rail-to-rail inputs and outputs that can run from a wide range of supply voltages. One of its main advantages for this application is its slew rate of 1.3 volts per microsecond. This is not especially much or especially little. But it’s just right for us. And this is why: A 40kHz signal with a peak-to-peak amplitude of 10 volts needs a maximum slew rate of 1.25 V/us. So 1.3 volts is enough when operating from a +/- 5V supply. And because it is just enough it will quite effectively block any high frequency noise/spikes that might be present at the input. This is a trick I’ve learned from Horowitz & Hill’s classic Art of Electronics. It’s my first time to use it so I’m exited to see how it works.
For now, the gain of the amplifier is controlled via a pot. Future designs will probably have a fixed gain once I’ve figured out how much gain we need.
Active Bandpass Filter
Just in case the slew rate limitation of the op amp isn’t enough to get a nice, clean output signal I have planned ahead and used the second op amp from the dual LMC6482 for an active band pass filter.
I’ve played around with an Excel spreadsheet and LT Spice for a few hours trying to find suitable values for the various resistors and capacitors. I’ll do some more experimenting once I can test the results on the real circuit. So don’t pay too much attention to the compoent values of this filter for now.
Signal Routing via 74HC4052 Dual 4-Channel Multiplexer
This is something that hasn’t changed much. The 74HC4052 has already been part of my last design. I’m now using two of them, one for transmitting and one for receiving.
The first half of the transmitting multiplexer (IC2 in the schematic) takes the PWM signal from the microcontroller and sends it to the correct Mosfet driver according to the axis and direction signals that control which transducer is sending and receiving. The second half of that IC releases the receiving transducer located opposite of the transmitting one. It does so by providing +5V to the corresponding p-channel mosfet. Pull-down resistors to the -5V rail ensure that the mosfets are conducting when not actively turned off. The +5V release signal can be controlled from a microcontroller pin. Not sure if we need this functionality so a future version might just connect this signal directly to the positive rail.
The first half of the receiving multiplexer (IC1 in the schematic) routes the signal from the receiving transducer to the amplifier input. Note that there are 10k pull-down resistors on the floating leg of the transducers so the received signal is centered around ground. In order to avoid cross-talk, the second half of IC1 actively grounds the transmitting transducer’s signal. In order to make this possible, there are 10k resistors in the signal path before the multiplexer. Given the very hight input impedance of the op amp this should not have a negative effect.
Power Supply
This circuit runs from a 12V input voltage that is directly used for the mosfet drivers. For everything else, a linear regulator generates a +5V rail. An ICL7660 inverts this voltage to generate a -5V rail. The multiplexers and the op amp then run from this +/- 5 volt supply. This is somewhat of a complication compared to the sleek plus-five-volt-only approach that I took with the Arduino shield. But this gives us a much stronger 12V drive on the transducers even if a future design will run on +/- 3.3 volts. And the split supply allow for easy control of the discrete p-channel mosfet switches and ground referenced signals in the receiving circuit.
On-board Microcontroller
I’ve included a PIC16F1936 on the board. No, I don’t have any plans to use a PIC16 in my final design. I just thought it is convenient to generate the singals necessary for testing right on the board. I do consider using a dedicated on board microcontroller in my final design. I see several advantages of doing so. The design would no longer be Arduino specific. You could still interface it to an Arduino using a standard I2C or SPI interface. But you could also interface it to a Raspberry Pi or just about anything else. That would make it much more flexible and versatile. And even if you interface it to an Arduino the Arduino is free to focus on other things than handling the technical details of running the wind meter. With the shield one had to pay close attention not to upset the timing by running other code. So a design with an on-board chip would be easier to use as well. Cost would not really be an issue since powerful microcontrollers are available for around 2$ even in modest quantities. Feel free to share your thoughts on this. I’m currently looking at different architectures but no decision has been made yet.
This is it for now. In my next post I’ll share my test results with this circuit. The Eagle files and PDFs are available as a download on the project overview page. As always I very much appreciate your comments and suggestions.
In my last post I’ve described the design and construction of my LED dimmer project. This project here is similar but a bit more involved. It controls RGB LEDs so it can not only change the brightness but also the color of the light. Instead of a simple pot it used a pair of rotary encoders with push buttons. One controls the brightness, pushing its button turns the light on or off. The other changes the color, pushing its button toggles between color and white.
Encoder’s side
There’s also a I2C interface included this time. I originally had the idea to hook this thing up to a Raspberry Pi and so be able to control the light from my computer or cell phone. I did establish an I2C connection to the RPi and it all works but it’s now installed as a stand-alone solution.
Since we’re now controlling RGB LEDs we obviously need three independant PWM outputs, one for each for red, green and blue. But let’s go through the circuit step by step.
Power Supply
The board is powered from a fairly powerful 12V supply that is always on. A LM2931 turns this into a microcontroller-friendly 5V. But if we want to connect this board to a Raspberry Pi we need to match the RPi’s 3.3 volts operating voltage. Apart from hobbyist projects there aren’t many microcontroller circuits running at 5V nowadays. Most of the PIC16Fxxx family of chips still handle 5 volts but this is becomming more and more of an exception. So in order to be compatible with the rest of the world this board will need a way to adapt it’s voltage.
What I’ve done here is the following: The board has it’s own 5V regulator and you can power from that using a jumper on the I2C header. On the other hand, if the board is connected to a Raspberry Pi over I2C, it will just freeride on the RPi’s 3.3V operating voltage. Since the board is only drawing a few milliamps at 3.3V this is perfectly fine. The RPi specs allow for 30mA or so to be drawn in this fashion.
Rotary Encoders
I’m using a pair of Bourns PEC11R-4215F-S0024. These are 24 steps-per-rotation encoders with a push button that I’ve used for other projects before. I’ve made it a habit to debounce switches and encoders in hardware rather than having to worry about it in software. There’s even an entire post just on that subject: https://soldernerd.com/2014/11/12/switch-debouncing-using-74hc14/.
So all 6 signals comming from the encoders are first RC filtered and then run through a 74HC14 schmitt-triggered inverter and reach the PIC nice and clean.
Microcontroller
I’ve once again used a PIC16F1936 but this is entirely uncritical since most microcontrollers come with the features needed here. We mainly need 3 10-bit PWM modules and an I2C interface if we want to connect to the Raspberry Pi.
The PIC is running at 32MHz using its internal oscillator which gives us a maximum (10-bit) PWM frequency of 31.25kHz which has proved adequate in my last dimmer project.
Output
I once again used the inexpensive yet powerful Infineon IPB136N08N3 N-channel MOSFETs. Since I have to drive 3 of them this time I need two LM7111 dual MOSFET drivers. As opposed to last time when each output had its own capacitor, they now all share a 1.5mF electrolytic cap.
Software
As so often, most of the interesting stuff happens inside interrupt service routines (ISRs). This one serves two tasks:
Read the input from the rotary encoders. Every time one of these input signals changes, an interrupt (interrupt-on-change, IOC) is triggered and the ISR calculates the updated values for brightness and color and sets an update flag so the main code knows that something has changed.
Send and/or receive data over I2C. The PIC is configured as Slave so it won’t do anything unless some other device attached to it will request or transmit data. The ISR just technically handles the sending and receiving o data. It just fills a receive buffer or sends data from a send buffer. It is entirely up to the regular code what should be sent and how received data is interpreted.
As I’ve mentioned I’m not using the I2C interface at the moment so the implementation is somewhat basic. Data can be sent to the board and it is stored in a recieve buffer but nothing is not processed. When asked for data it transmits up to 11 bytes indicating it’s current state of operation such as brightness of each color channel and some more data.
There is also nothing preventing the content of the buffer from being changed while a transmission is in progress. So if you’re planning to really use this I2C feature you probably want to improve it somewhat but the code (download link at the end of this post) gives a good, working starting point. If you need help, just ask.
Controlling the outputs is not that challenging. Its jus 3 10bit PWM modules running 120 degrees out-of-phase to smoothen the current seen at the input. Again, the LM7111 I’ve used are of the inverting type so the duty cycle has to be inverted in software.
I’ve used a lookup table for brightness (only 32 brightness levels this time) and color. I’ve defined 24 colors that make a nice color circle. You can turn the color encoder infinitely and just loop through the colors defined in the lookup table. When you press the button on the encoder, the color changes to plain white but the color is remembered so when you press the button again the same color comes back. Brightness works in a similar way: press the button and the light goes off, press it again and the light is back with the same brightness as before. Overall, this makes a quite intuitive user interface.
Testing and Troubleshooting
Acoustic noise was not an issue this time. I started with 31.25kHz switching frequency and 120 degrees phase shift right away. Apart from that the power level is lower, more like 70 watts maximum. And I was using a different supply that might be less susceptible to acoustic noise. don’t know, haven’t tried.
Mass connections have proved to be a problem, though. Usually I take great care during board layout to make sure all components have excellent ground connections. Together with the generous use of 100nF ceramics decoupling capacitors this prevents lots of problems before they even appear. Thank you John Catsoulis (http://shop.oreilly.com/product/9780596007553.do) for stressing this point when I started designing my own circuits. You might have noticed that just about every IC on any of my designs has its own ceramic cap on each of its power supply pins. That’s thanks to John and it has served me very well.
But back to the problem: It seems that this time I’ve been a bit sloppy with my ground connections around the two MOSFET drivers and the encoder on the right. They’re not that bad but aparently not good enough. The LM7111 are quite powerful. Up to 5Amps peak current according to the datasheet. And together with my not-so-great ground connections that was enough to get false triggering from that encoder. A few wire bridges improving the ground connections solved that problem. I’ve already fixed that problem in Eagle so the files available for download should be fine.
There was also another problem: It was impossible to turn the green (middle) channel off entirely. No matter what I did in software, the green LEDs always stayed on if only a little bit. I looked at the PWM signal from the PIC on a scope and there was a slight glitch every full PWM period, aparently when the PWM register overflows from 1023 to 0. The other two channels (red and blue) didn’t suffer from this problem.
As I said, I have to correct for the inverting nature of the LM7111 in software. The enhanced (ECCP) PWM modules can do this automatically. But there are only two if them in a PIC16F1936 so I had to use a regular (CCP) module for the green channel. So in order to turn the green LEDs off the duty cycle has to be 100%. And that seems to be impossible without that little glitch.
I first tried a pull-up resistor on that PWM signal but that didn’t help. The pic seems to actively pull that pin low. So I resorted to a 10pF cap to ground which finally solved the problem.
Since the board is installed hidden in some kind of bookshelf I didn’t make a new pretty board with all these fixes already in place. But I’ve now been using it for two months or so and it works perfectly every day.
I’ll finish this post with a few impressions of the final product and the download link below.
As always, here you find the Eagle Files, PDFs of schematic and Board as well as the code.
I have recently moved to a new apartment and was looking for a PWM dimmer to control some 12V LED strips. I thought that should be easy enough nowadays but it proved more difficult than I thought. All I found either didn’t meet my requirements, were uggly or expensive. So I decided to build my own, tailor-made to my needs.
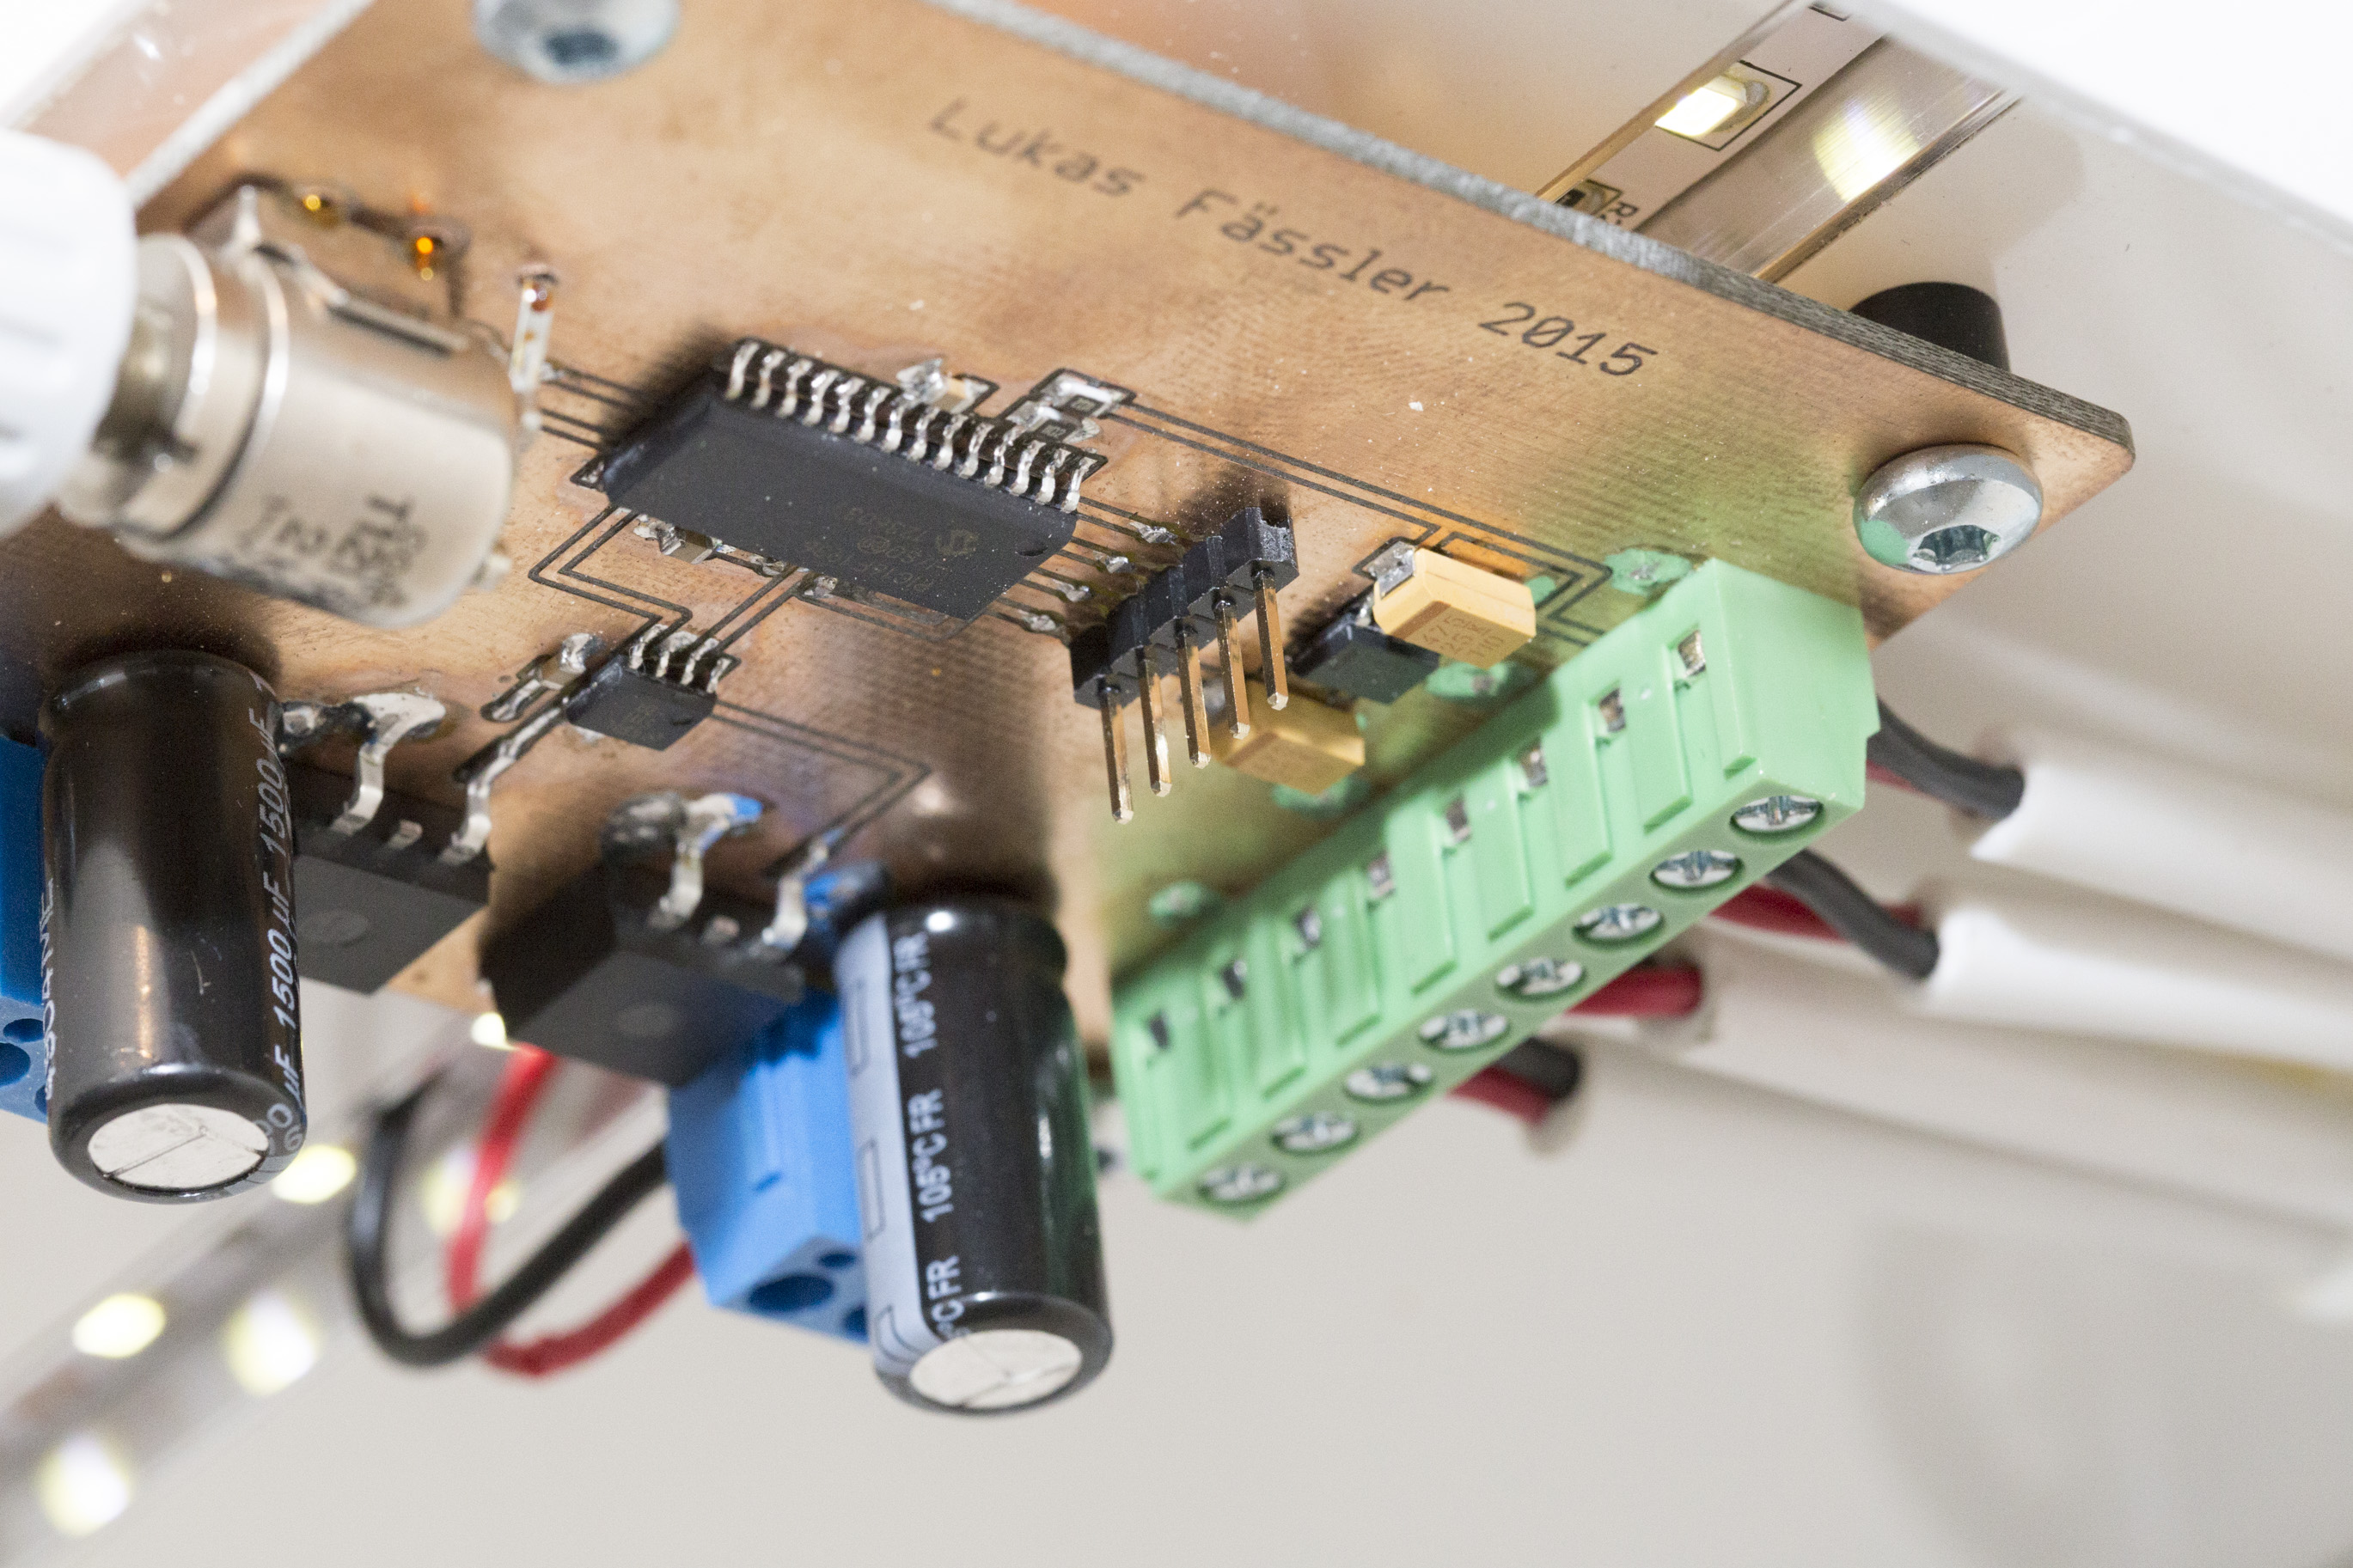
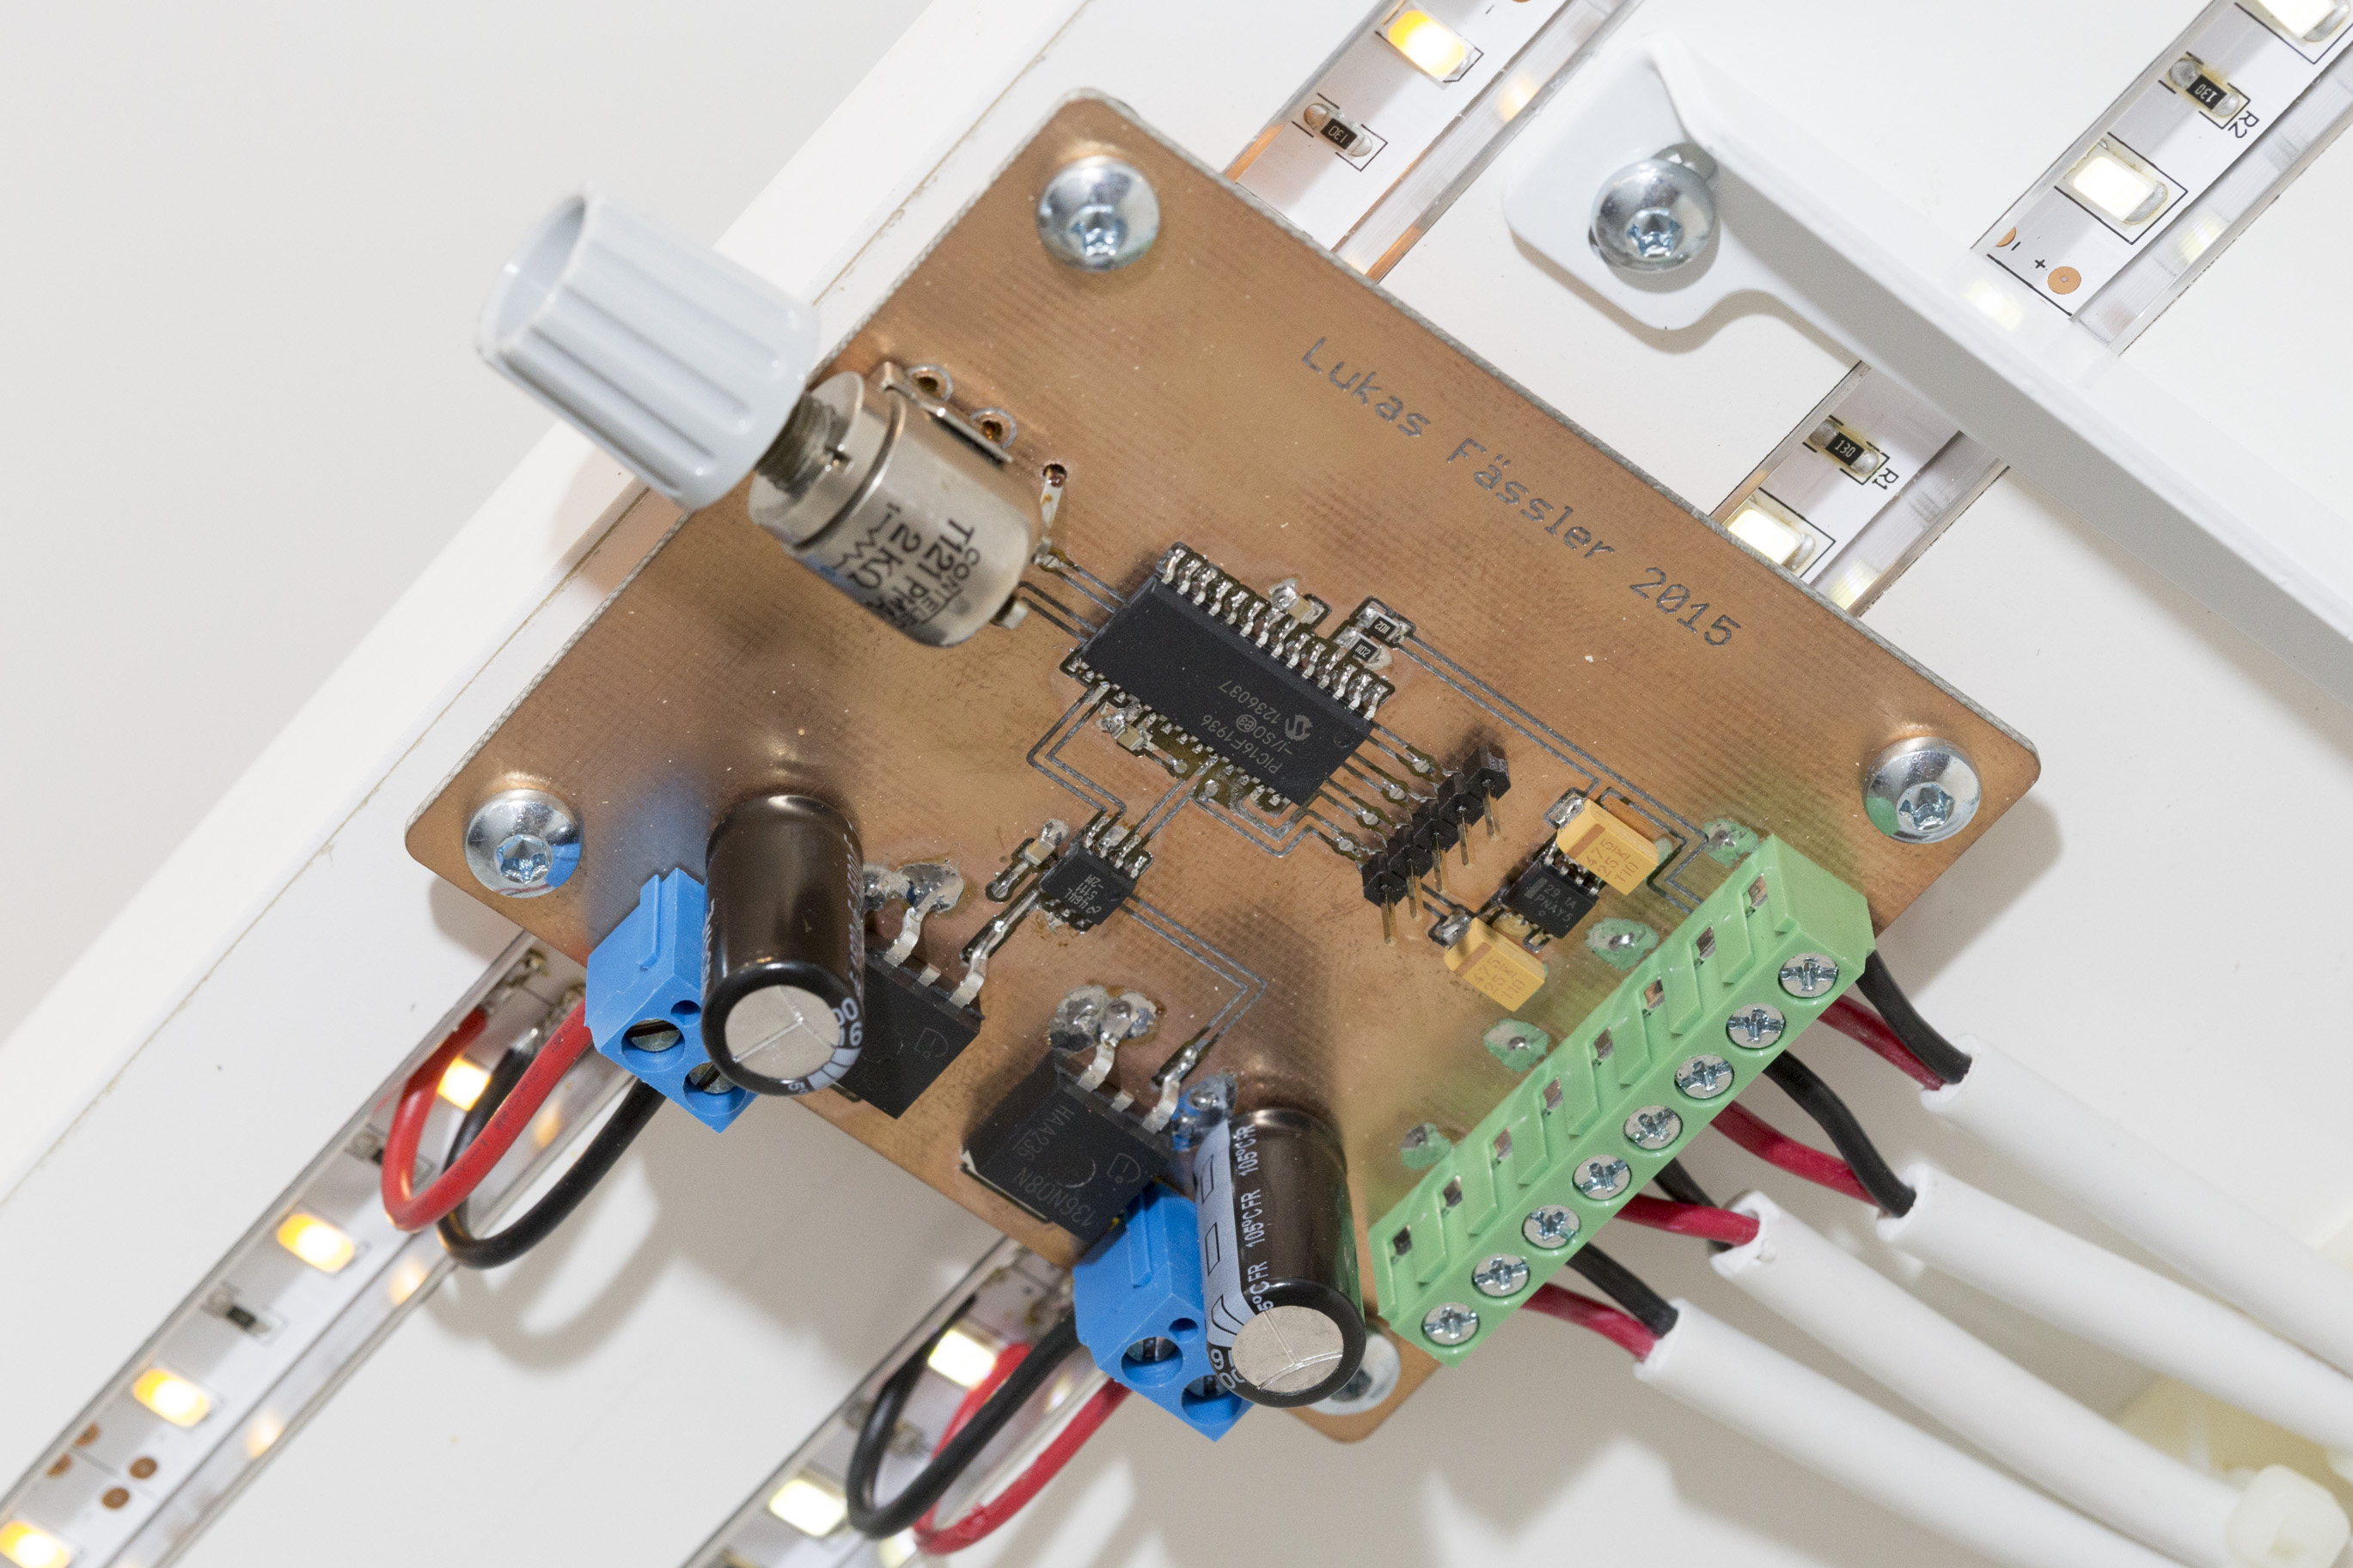
Finished PCB mounted below a shelf
The requirements
Handle 100W @ 12Volts comfortably
Controlled by a simple on-board pot (no remote control or the like)
Affordable
No acoustic noise
Fine-grained control down to very low brightness levels
I’ll go through these requirements one-by-one.
Two LED strips below the shelf give a nice lighting on the desk
Handle 100W @ 12Volts comfortably
My LED strips suck up a bit more than 20 Watts per meter and there is a maximum of 4-5 meters of LED strips per dimmer so I need a power rating of around 100W. If you do the math you’ll find that there will be a maximum current of about 8.3 amps.
I don’t want this thing to get hot nor do I want to put a heat sink on it. So the total power dissipation in the dimmer should stay below, say, 1 watt. So if we use a single FET, we need a Rds-on of 14.5 milliohms. Thats not a lot but there are inexpensive MOSFETs that meet this requirement. And we can always parallel two or more of them if necessary.
And yes, there will also be some switching losses but they should be low given the modest switching frequency of an application like this.
PIC microcontroller with its power supply
Controlled by a simple on-board pot
This is most likely the simplest way of controlling a dimmer but it’s surprisingly hard to find. A lot of commercially available dimmers come with IR remote controls nowadays. And some of the higher quality models expect a 0-10V control signal which means that you have to use an external pot which you have to mechanically attach somewhere. I would like everything on a single PCB to keep things simple.
Affordable
I needed 3 of these things so cost was a factor, too. All the nicely-made dimmers I could find were priced at $50 and uppwards. Not that bad but I figured that I could make my own for a small fraction of this, perhaps $10.
No acoustic noise
We all know those dimmers that produce audible humming. Especially when dimmed somewhere half-way down. I hate it. Drives me crazy.
This proved to be more difficult to archieve than I thought. More on this later.
Since the power supply has 4 output leads, my dimmer has a 8x connector at its input
Fine-grained control down to very low brightness levels
This is where most products fail miserably. Most of those remote-controlled things only have 8 brightness levels. And just about everything I found works linearly which makes very little sense if you ask me. We humans perceive brightness logarithmically, rather than linearly. So going from 1% to 2% seems the same as going from 50% to 100%.
Beefy mosfet and capacitor
Linear control will not give you fine control at the lower end. Ideally, you want to have an exponential transfer function from pot position to PWM duty cycle to compensate for the logarithmic nature of the human vision. I found the easiest way to do this was using a microcontroller. Furthermore, the ability to do all of this in software enables you to play around with it and find a transfer function that you’re happy with.
High granularity at the lower end also means that we need quite a bit of PWM resolution. The common 8-bit resolution translates to about 0.25% per step. Going from 0.5% (wich is about what I mean by very low brightness) to 0.75% is already quite a step. Many microcontrollers are capable of 10 bits which is 4 times better and probably good enough.
Yet another view
The design
At the center of my design is a 8-bit PIC microcontroller, a PIC16F1936. There’s not much special about this particular model, it’s just a type I’ve used several times before and still had some on stock.
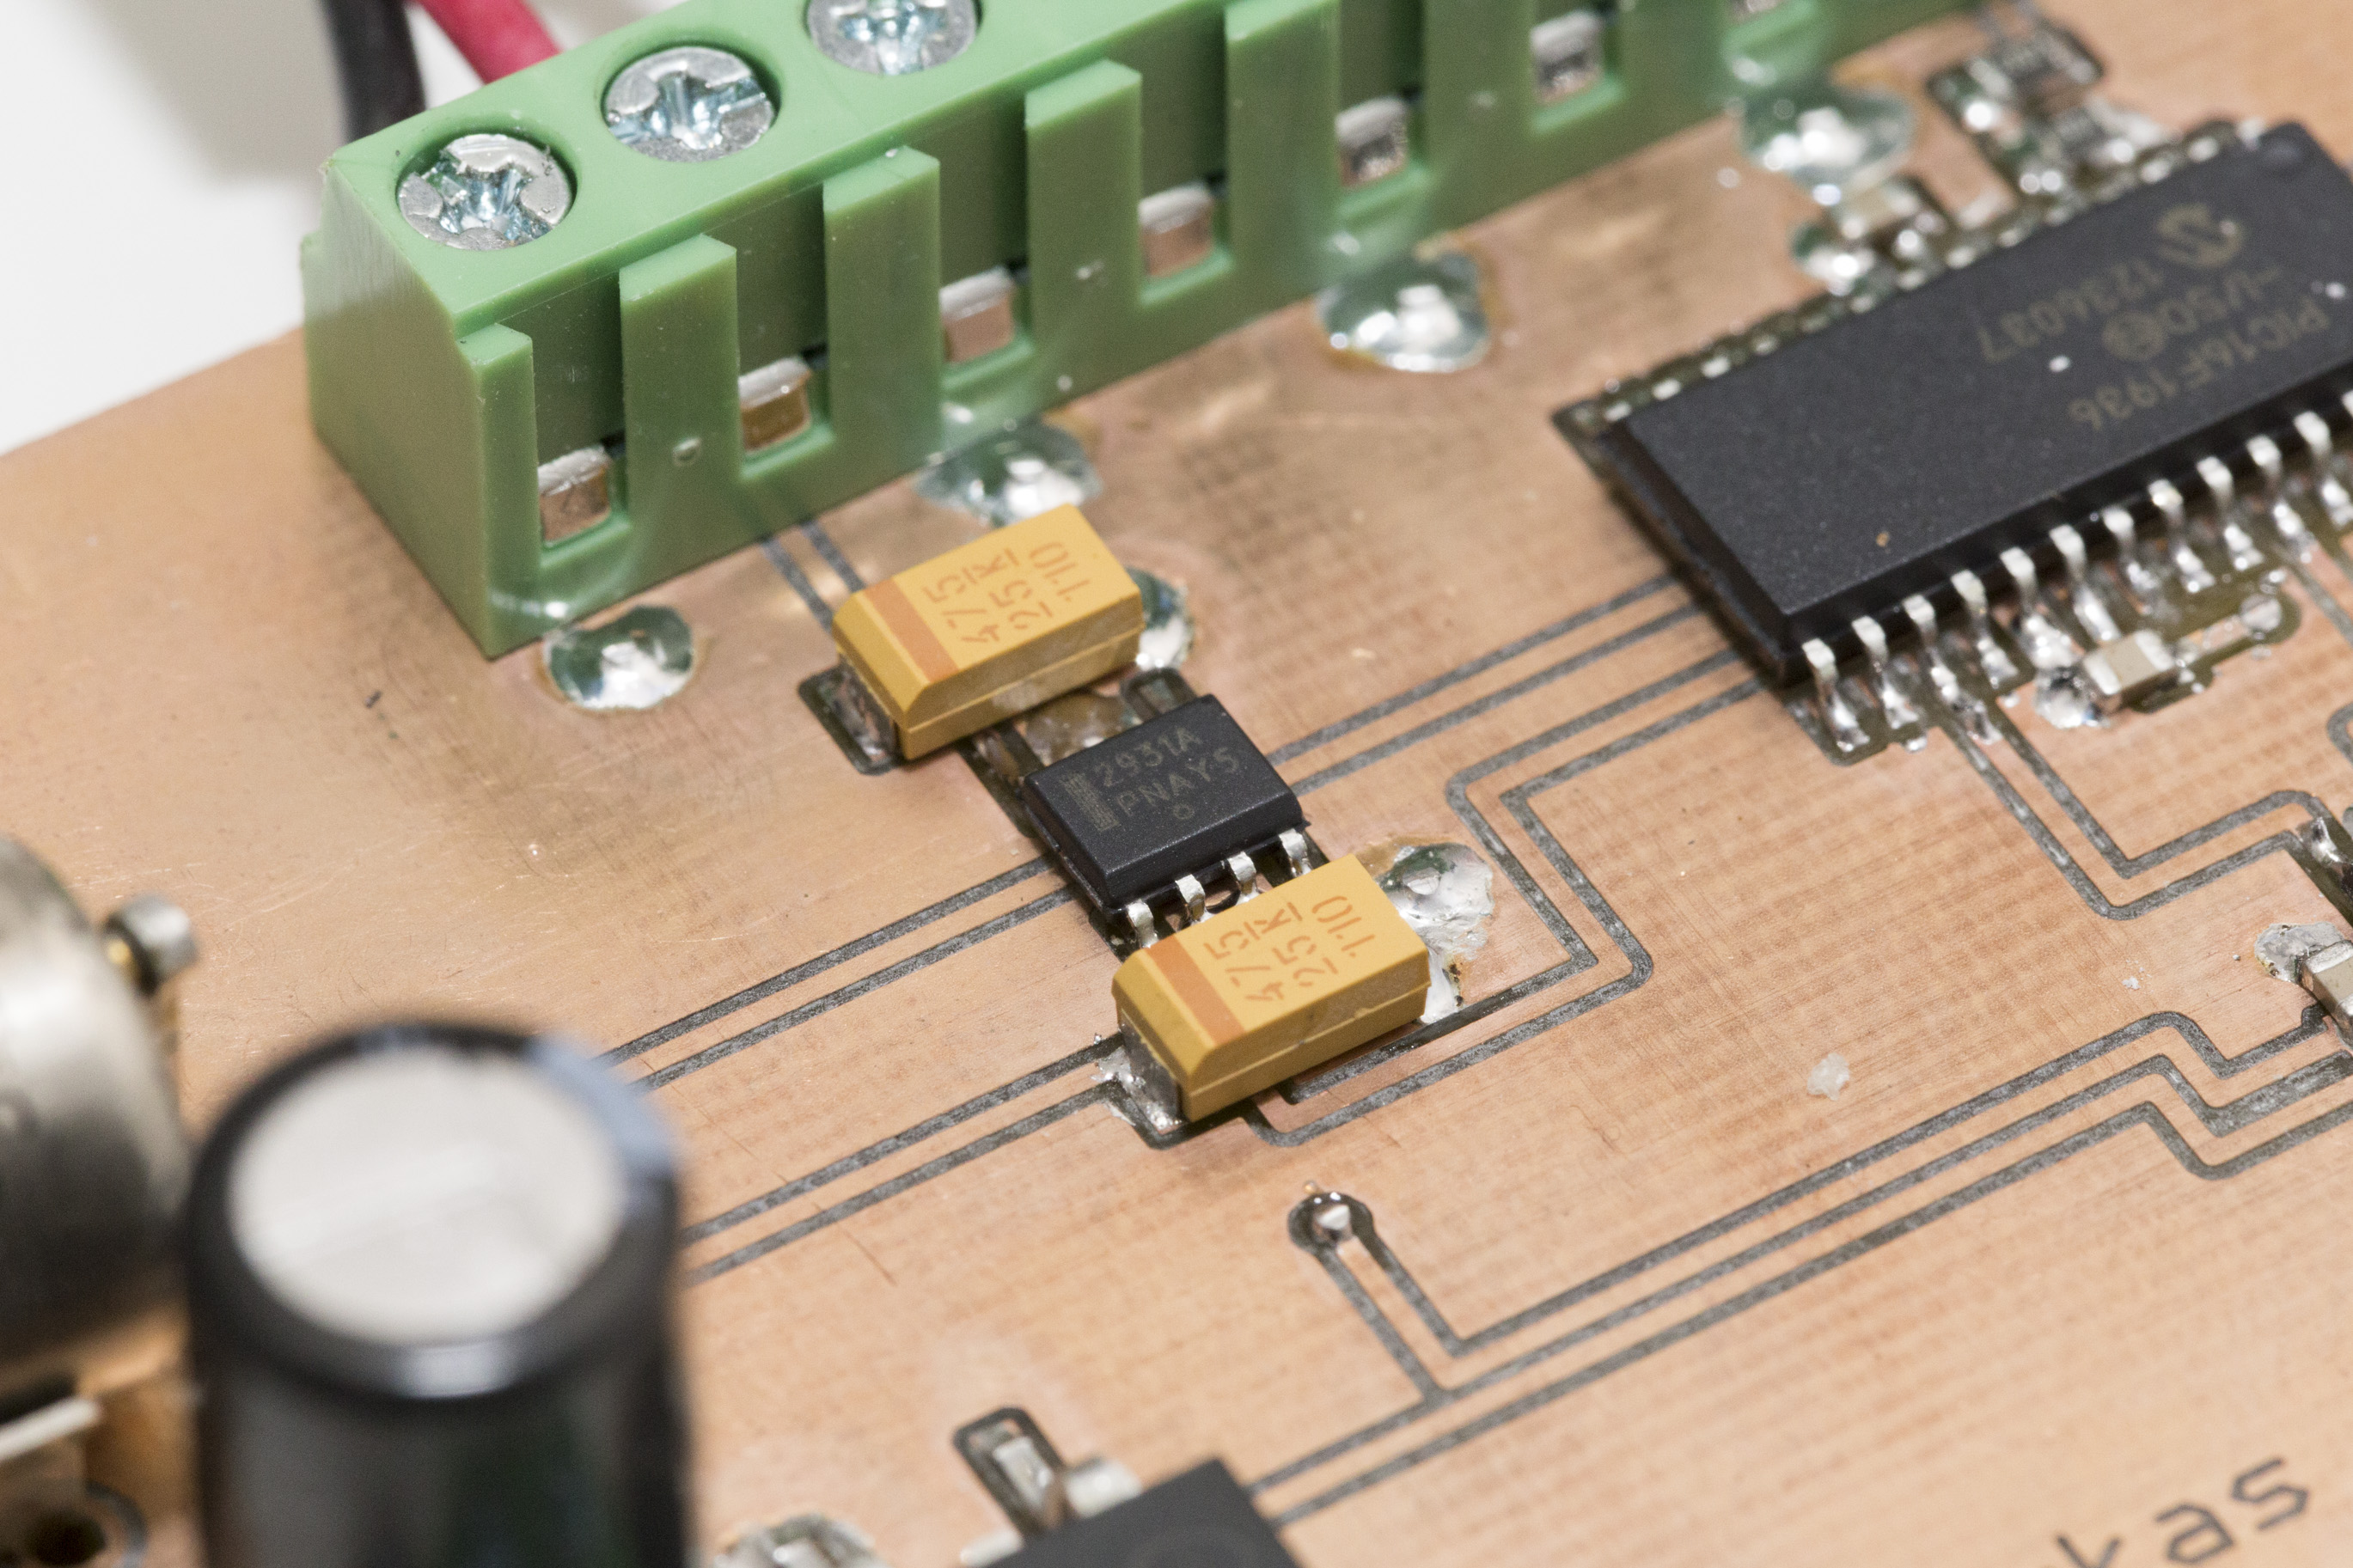
A LM2931 provides the PIC with 5 volts from the 12 volts input voltage. I use the LM2931 as my standard 5V regulator. It’s pin compatible with the legendary 7805 but survives input voltages in the range of -50 to +60 volts making it very robust against transients.
A LM2931 generates 5V from 12V
The PIC controls a LM5111 dual FET driver that provides a powerful 12V gate drive to a pair of Infineon IPB136N08N3 N-channel MOSFETs. This is the same transistor that I’ve recently used for my Arduino Solar Charger Shield. Its an inexpensive (< $1), large SMD type with an exellent Rds-on of 11.5 mOhms.
There are several variants of the LM5111. It comes in inverting and non-inverting configurations as well as combinations of inverting and non-inverting. At Farnell, the the inverting ones were by far the cheapest so that’s what I’m using here. It doesn’t really matter since you can change the polarity in software as needed.
Pot and one of the output drivers
Why am I using two FETs despite the fact that one could easily handle the entire current? First, I’m driving two LED strips with this dimmer and using two transistors simplifies the layout so I have two outputs exactly where I need them. Secondly, the LM5111 is a dual FET driver anyway so I get the second gate drive for free.
Nice 2kOhm pot
I’ve provided each output with a generous 1.5mF capacitor in order to shield the supply from the ripple that is inevitably produced by the PWM. I’ve also taken care to use a cap with low serial resistance (ESR) and a high current rating. The Panasonic FR series fulfills both of these requirements while being good value for money. I thought this should be enough to avoid excessive ripple and therefore also acoustic noise.
Top side of the long version
The input to the PIC comes from a quite nice 2 kOhms pot that I’ve recovered from some scrap. There is also a voltage divider to measure the 12V input voltage. The idea was to only enable the output once the input voltage has stabilized but I found this to be a quite unnecessary feature when programming the PIC.
Bottom side of the long version
The Layout
Top side of the short version
I’ve built the two different versions of this dimmer. The schematic is exactly identical for both of them, they only differ in their physical layout and board dimensions. I’ve just tailor-made them to their specific application so the pots are located in a handy position and the outputs are exactly where I need them.
Bottom side of the short verison
Software and Testing
My first version of the software measured the voltage from the pot using the on-chip ADC and outputed an identical 2kHz PWM signal on both outputs. 2kHz should be enough to avoid visible flicker and seemed a reasonable choice. Everything worked but the power supply made quite a bit of noise over most of the brightness range. Worse than any commercial design. Even worse, there was an awful lot of flicker. Ouch.
Too much ripple producing lots of audible noise
Looking at the power supply output / dimmer input voltage on a scope if became clear that the two 1.5mF caps still allow too much ripple at this frequency.
The first thing I tried was running the two outputs out-of-phase. Since I’m using two FETs I have two independent outputs. So I can run them 180 degrees out-of-phase. Now, at duty cycles below 50% it looks like I’m only driving a load half the size with a frequency and duty cycle twice as high. At precisely 50% duty the supply even sees a constant load at its output since exacly one LED strip is on at any point in time. At duty cycles above 50% the on-times overlap so the load only varies from 50% to 100% and with twice the frequency. As you can see from the scope screenshot below, this already helped a great deal but the problem was not yet resolved. So the natural thing to do was to increase the PWM frequency.
Running the outputs out-of-phase helps
At 8kHz, things already looked (and sounded) much better. Ripple and acoustic noise were much reduced but the supply was still audible at least in a quiet environment.
Increasing the PWM frequency to 8kHz almost solves the problem
So I moved the PWM frequency up as far as i could. Given the PIC’s 32MHz clock and a 10 bit resolution this was 31.25kHz. Now every last bit of audible noise was gone. Finally.
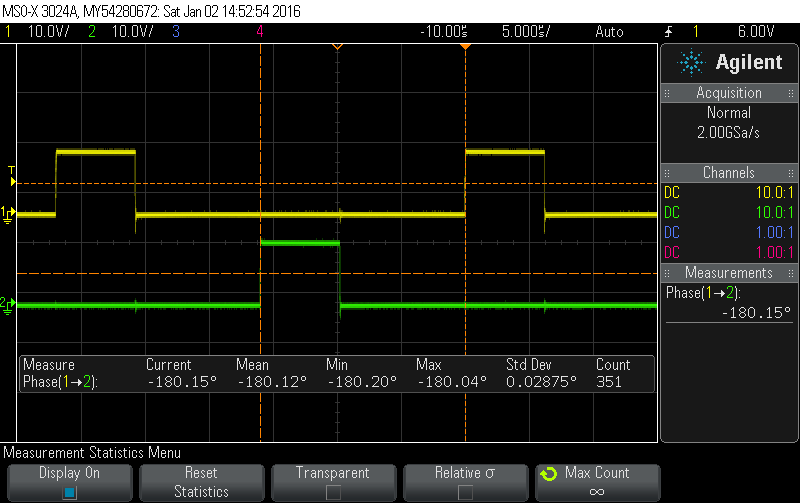
At 31.25kHz all the noise is finally gone
I then noticed that the phase shift was 176 degrees as opposed to the intended 180 degrees.
Phase shift is 4 degrees off
Not that this makes much of a difference in practice but I solved it anyway. I’ve implemented this phase shift by starting one PWM module at 128 and the other at 0 (we’re only talking about the 4 most-significant bits here, so the maximum is 255). The two instructions are on successive lines in my C code but 3 clock cycles are needed to process each of them so they are not enabled at the precisely same time. Starting the first PWM module at 131 has solved the problem as you can see below.
Now the phase shift is fixed
With these changes in place the flicker mentioned previously was also much reduced but had not yet disappeared. Looking at the voltages on a scope for a while the problem became clear. I was measuring the voltage from the pot at fixed intervals that had no connection with the switching frequency. So I was effectively measuring at random points in time.
I said that the input voltage now showed much less ripple but some ripple is inivitable. Some of that ripple is likely to somehow feed through to the voltage from the pot. That introduced noise in the value measured by the ADC which lead to variations in the duty cycle which was noticable as flicker.
I did two things to resolve this. First, I’m generating an interrupt signal (from the same timer as I use for the PWM) every 64 PWM cycles. In the corresponding interrup service routine (ISR) I read (and save) the ADC value and start a new conversion. This way I’m always measuring at the same point during the PWM cycle. So the effect of the ripple should be similar every time. I’m also averaging 32 measurements which further helps to smooth the value I’m using to calculate the duty cycle. So flicker is gone as well as you can see below.
After averaging the ADC readings, the duty cycle stays rock solid
Now for the transfer function. My first try was exponential. The problem with that was that it gave away too much of the pot range for very low brightness levels. I played around with this for quite some time and finally settled for a combination of linear (at the very low end of the range) and exponential (for everything above that). Also, two of my dimmers can be fully turned off by turning the dimmer all the way to the left. Their power supply is always on and the light is only controlled by the pot so I need to be able to really turn them off (not only down). The third one has a slightly different transfer function that only allows to turn it down to 2% or so. That one has its power supply controlled by a conventional light switch so I don’t want the pot to completely turn it off.
Same at lower duty cycles
The result
After all, I’m very happy with the result. There is no noticable power dissipation on the board. There certainly is a bit of dissipation but the board doesn’t heat up noticably so I’d say its clearly below a watt.
The components have cost me around $10 per board. Some stuff like the connectors I have bought a flea markets, they can be surprisingly expensive through regular retail channels. The PCBs are home-made so they have cost me a considerable amount of time but not much in terms of cash.
LM5111-2M is the inverting variant
They are, furthermore, controlled by a simple pot, produce no audible noise and can be finely dimmed just as planned. So I can proudly state that all the requirements have been met.
If you’re in need of a dimmer and have a soldering iron and a bit of spare time I can only encourage you to build your own. It’s not too hard, needs only few components and is very doable on a prototyping board if you don’t want to etch or mill your own board.
As always, attached is a zip file with all the eagle files, board layouts, schematic as well as the software.
There have been two previous posts on this project: one on the concept and the hardware and one on hardware testing. You probably want to check them out first if you’re not yet familiar with this project. Or even better: Click here for an overview over this project.
Maintaining an input voltage of 17 volts even if that means a lower-than-desirable voltage at the output
Now that we know that we have a functioning MPPT solar charger we are ready to talk about the software (or the sketch as the Arduino folks call it). It’s quite simple, really. So this will be a short post. And yes, you can download the sketch. There is a link at the end of this post. As always, I appreciate any feedback, comments and the like.
There is a number of basic tasks the arduino needs to perform in order for this shield to be useful. I’ll go through them one by one.
Controlling the DC-DC converter
At the heart of this project there is a synchronous step-down (or buck) DC-DC converter that is controlled by a PWM signal from the arduino. So one of the tasks is to set the frequency and duty cycle of that PWM signal.
We let the PWM signal run at the maximum frequency the arduino allows with an 8 bit resulution. Thats simply 16MHz (the Arduino’s frequency) divided by 256 (the 8 bit resolution), or 62.5 kHz. So the prescaler will be 1.
As you can see from the shields’s schematic, we need to output the PWM signal from Pin 6 (by the Arduino’s pin numbering, not Atmel’s). In order to do this kind of low-level stuff you’ll have to read the Atmega328’s data sheet. There is usually no Arduino-ish shortcut if you really need to controll what’s going on.
Luckily it’s just a few lines of code to set things up. All in the function buck_setup(). There are three more little functions to control the DC-DC controller once it’s set up:
buck_enable() and buck_disable() are very simple and just turn it on and off, respectively. buck_duty(uint8_t duty) is only slightly more involved. It changes the duty cycle to the value you pass to it. Besides that it ensures that the duty cycle stays within certain limits.
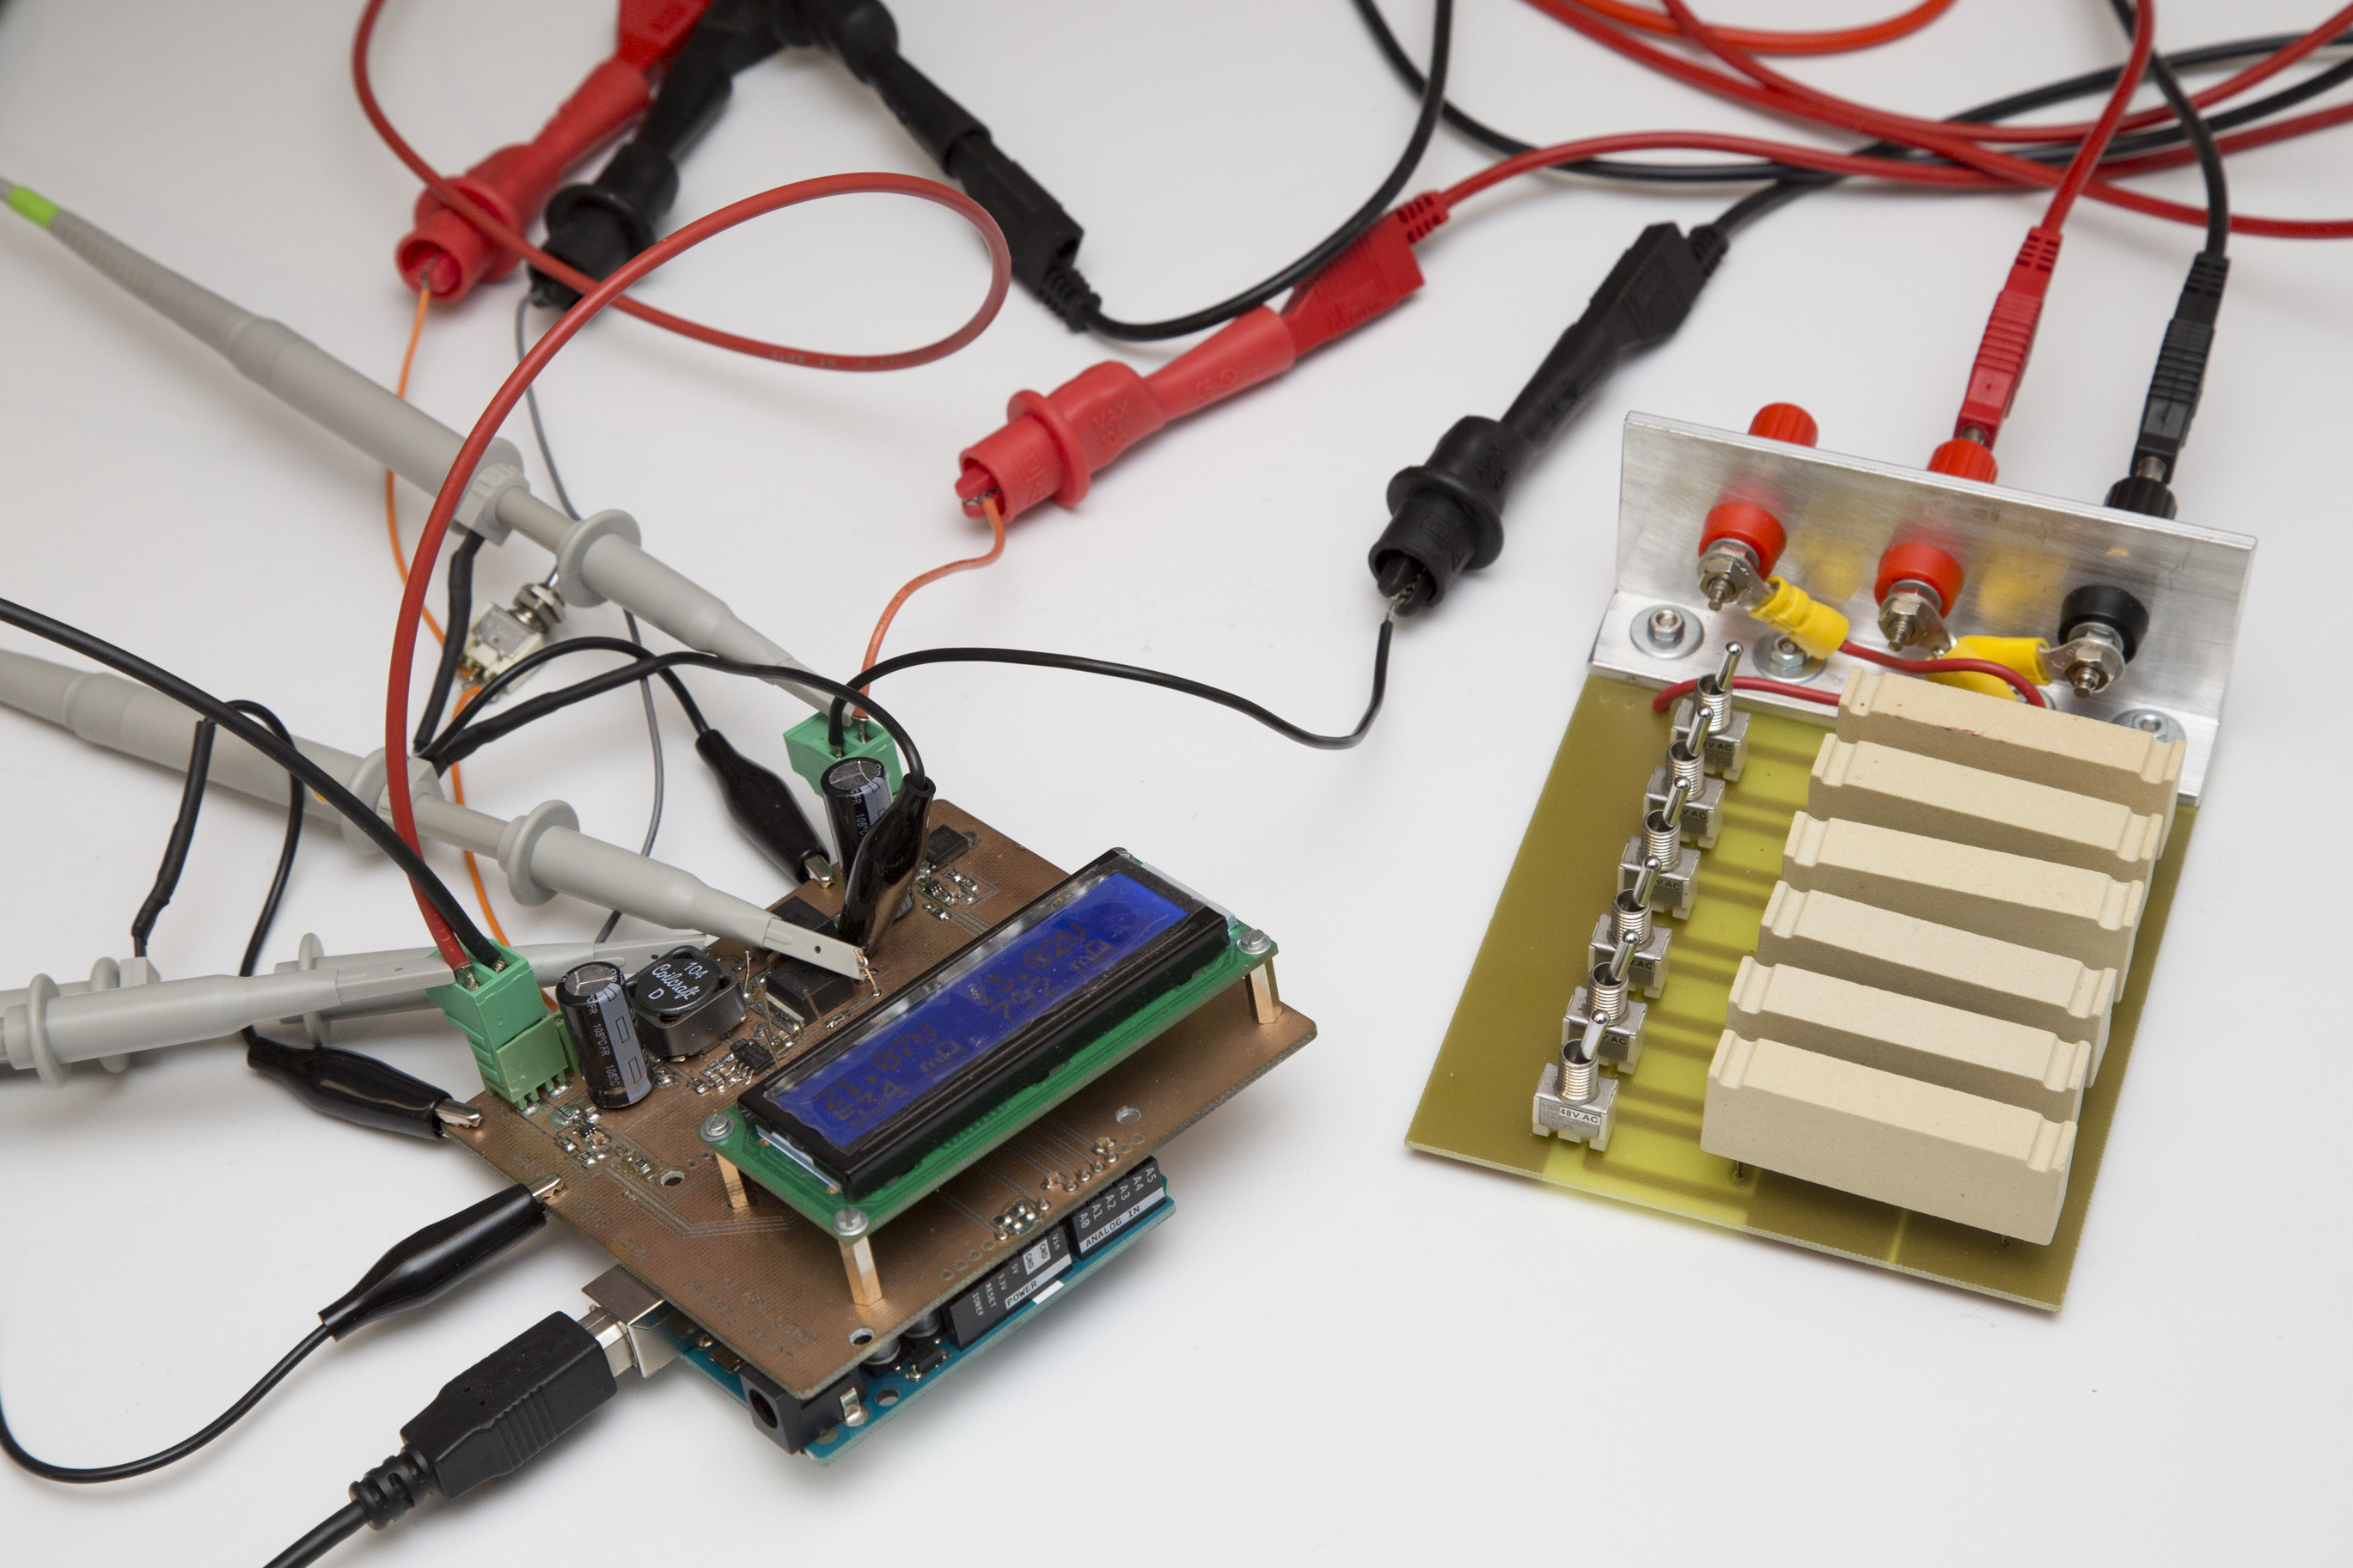
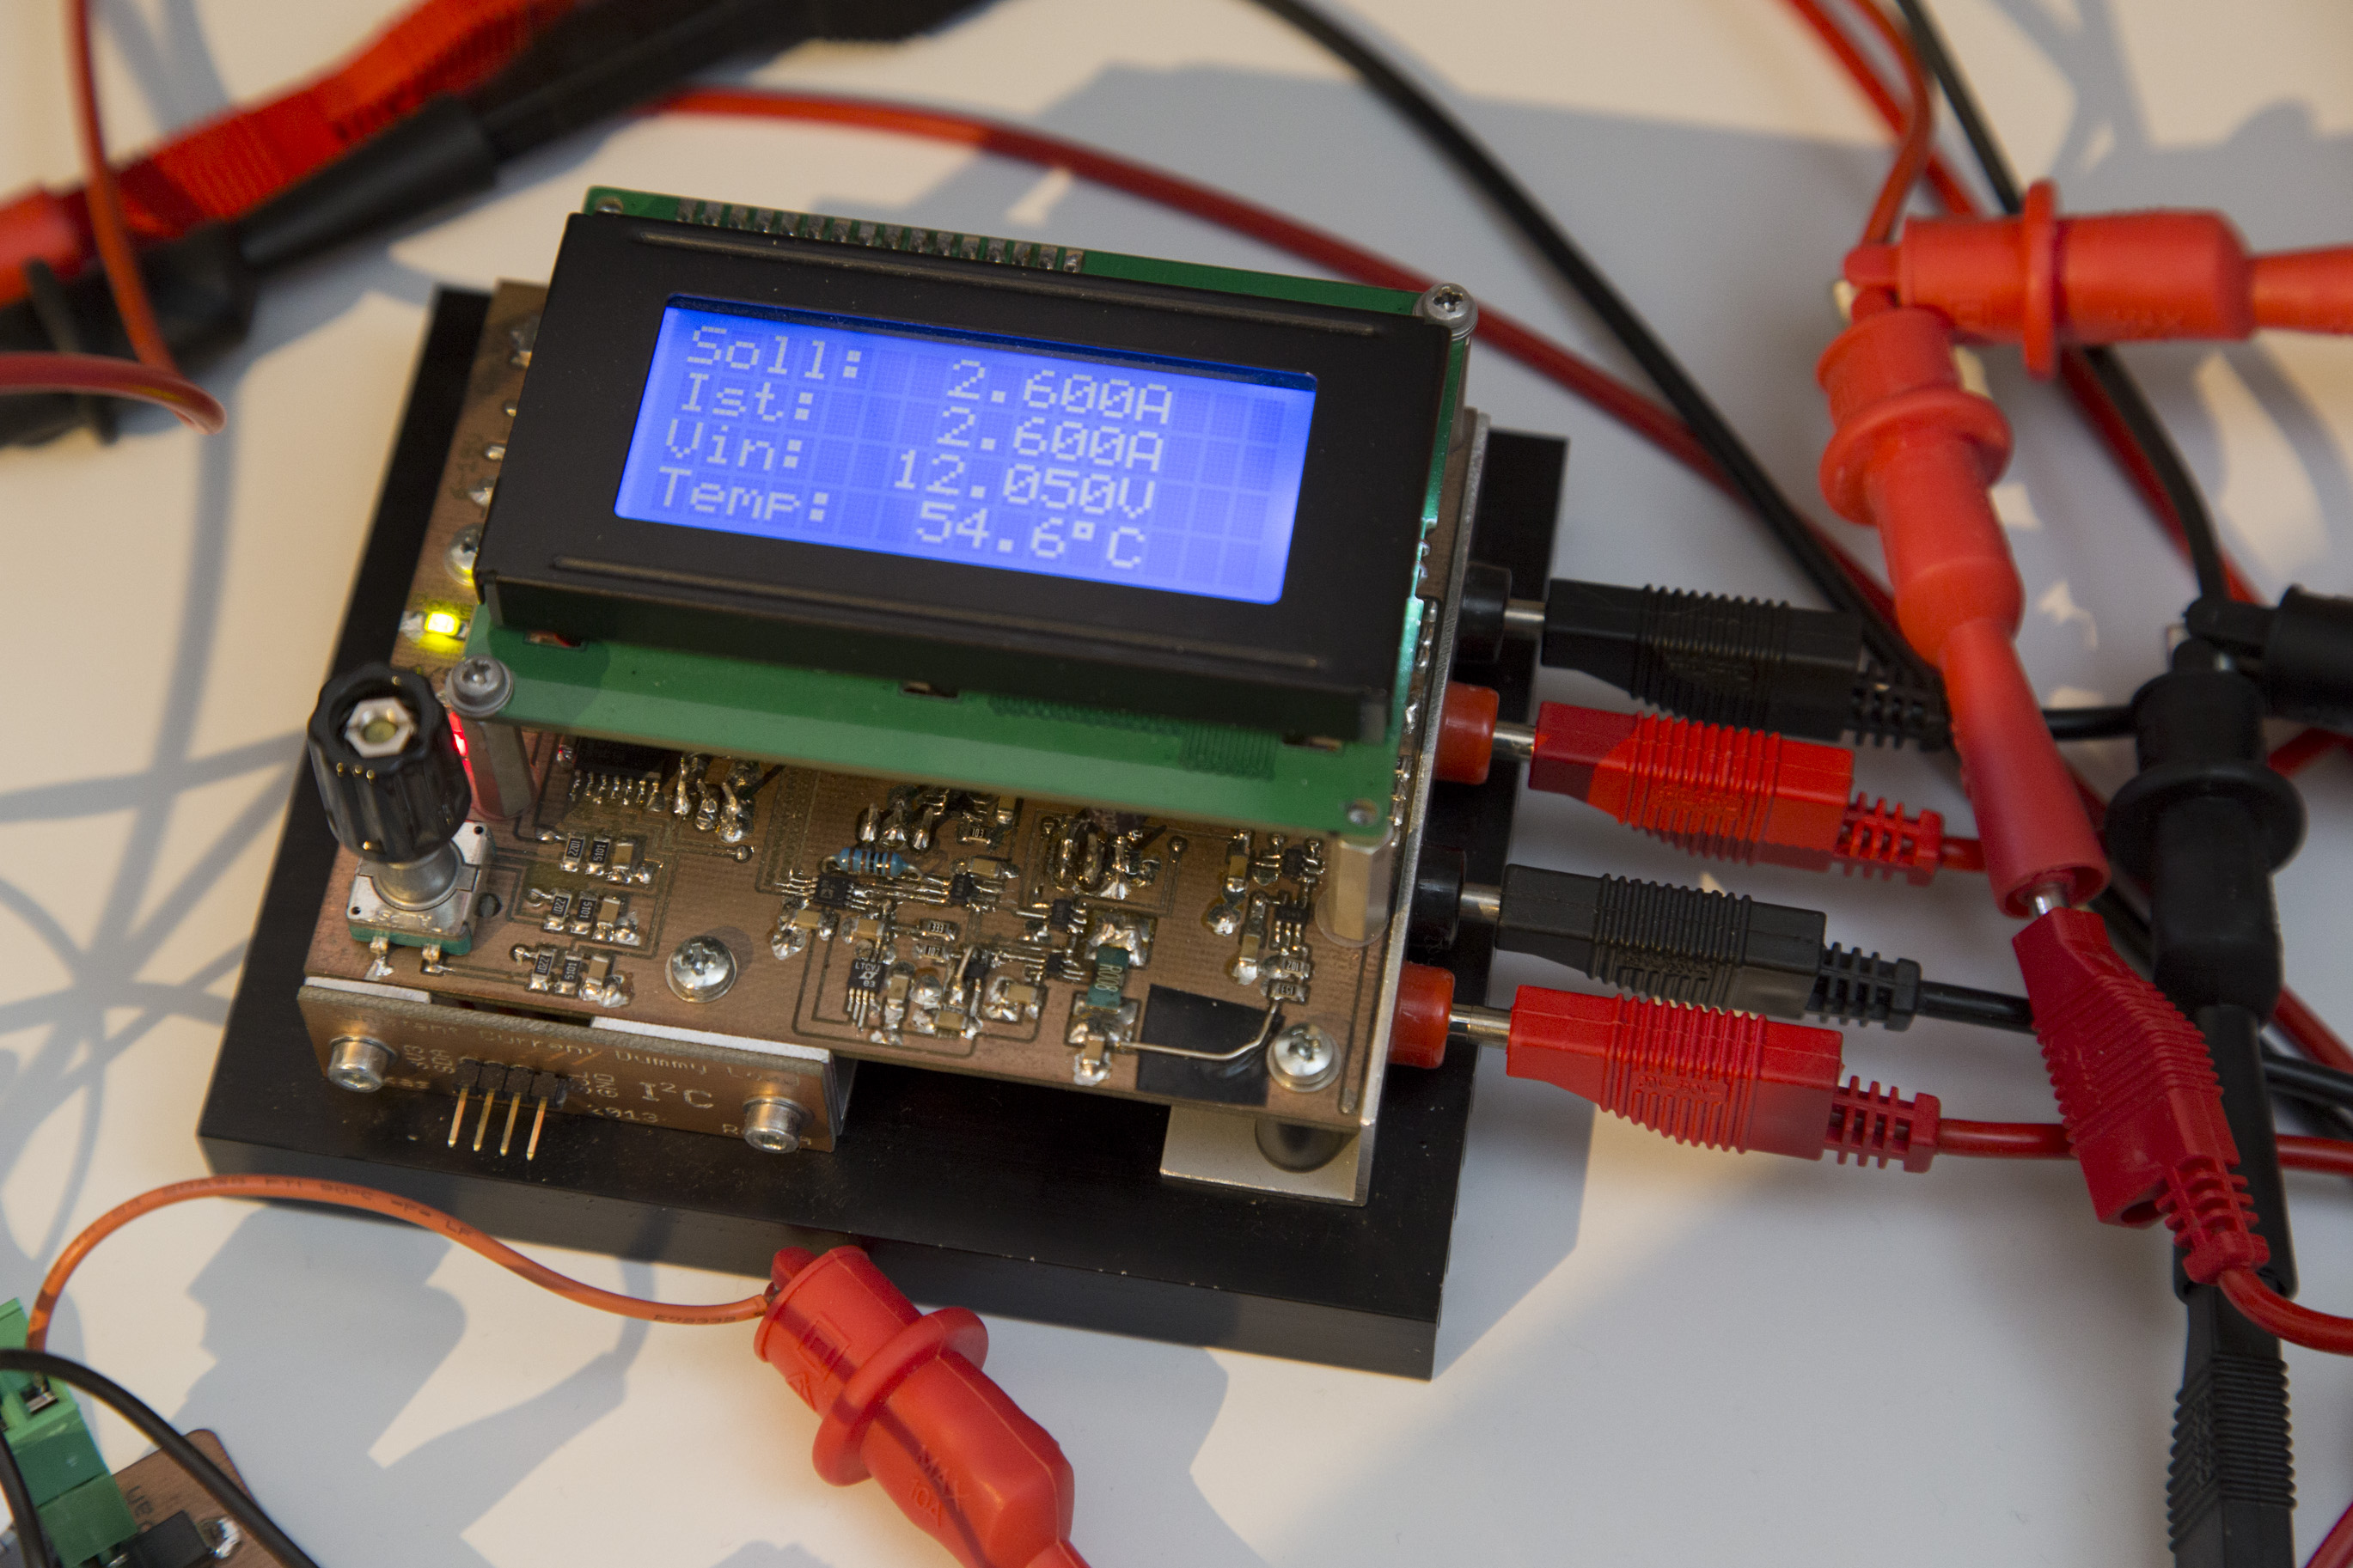
Test setup with resistor-based dummy load
You don’t want it to go to 100% since in order to keep the bootstrap capacitor C6 charged you need a little bit of off-time. In order to drive the upper FET you need a voltage higher than the panel’s voltage and that’s exactly what C6 is for. So we enforce an upper limit on the duty cycle.
Likewise, you don’t want your duty cycle to go below 50% because in that case you would be pumping energy from the battery to the pannel. A synchronous step-down converter is basically the same thing as a synchronous step-up (aka boost) converter with input and output confused. So we also want to enforce a lower limit on the duty cycle.
The upper and lower limits are set through the #defines DUTY_CYCLE_MINIMUM and DUTY_CYCLE_MAXIMUM.
Measuring voltage and current
The shield has all the hardware necessary to measure both voltage and current both at the input as well as on the output. We’ll just need to write some simple software to make good use of that hardware.
Unlike with the PWM singal where we had to do some low-level bit fiddling ourselfs we can just rely on convenient Arduino library functions to do the job. Basically, analogRead() is all we need here.
Nicely regulating so that the input stays at 17 volts
I’ve written a function called read_values() that uses analogRead() to read all 4 values (input voltage, output voltage, input current and output current) 16 times each, averages the results and converts the ADC reading to proper voltages and currents.
The necessary multipliers are defined as floats in VIN_MULTIPLIER, VOUT_MULTIPLIER, IIN_MULTIPLIER and IOUT_MULTIPLIER. I’m doing all the voltage and current measurements in floating math. Yes, this is not at all efficient but we don’t need the Arduino’s computational power for anything else most of the time so this is fine here. Just keep in mind that you can save a lot of resources here if you ever need to do so.
Displaying voltage and current on the LCD
Our hardware also involves a 2 lines x 16 characters LCD so we can show the world what we are measuring. Again, we can rely on standard Arduino functionality to do the job. There is an LCD library that does everything we need.
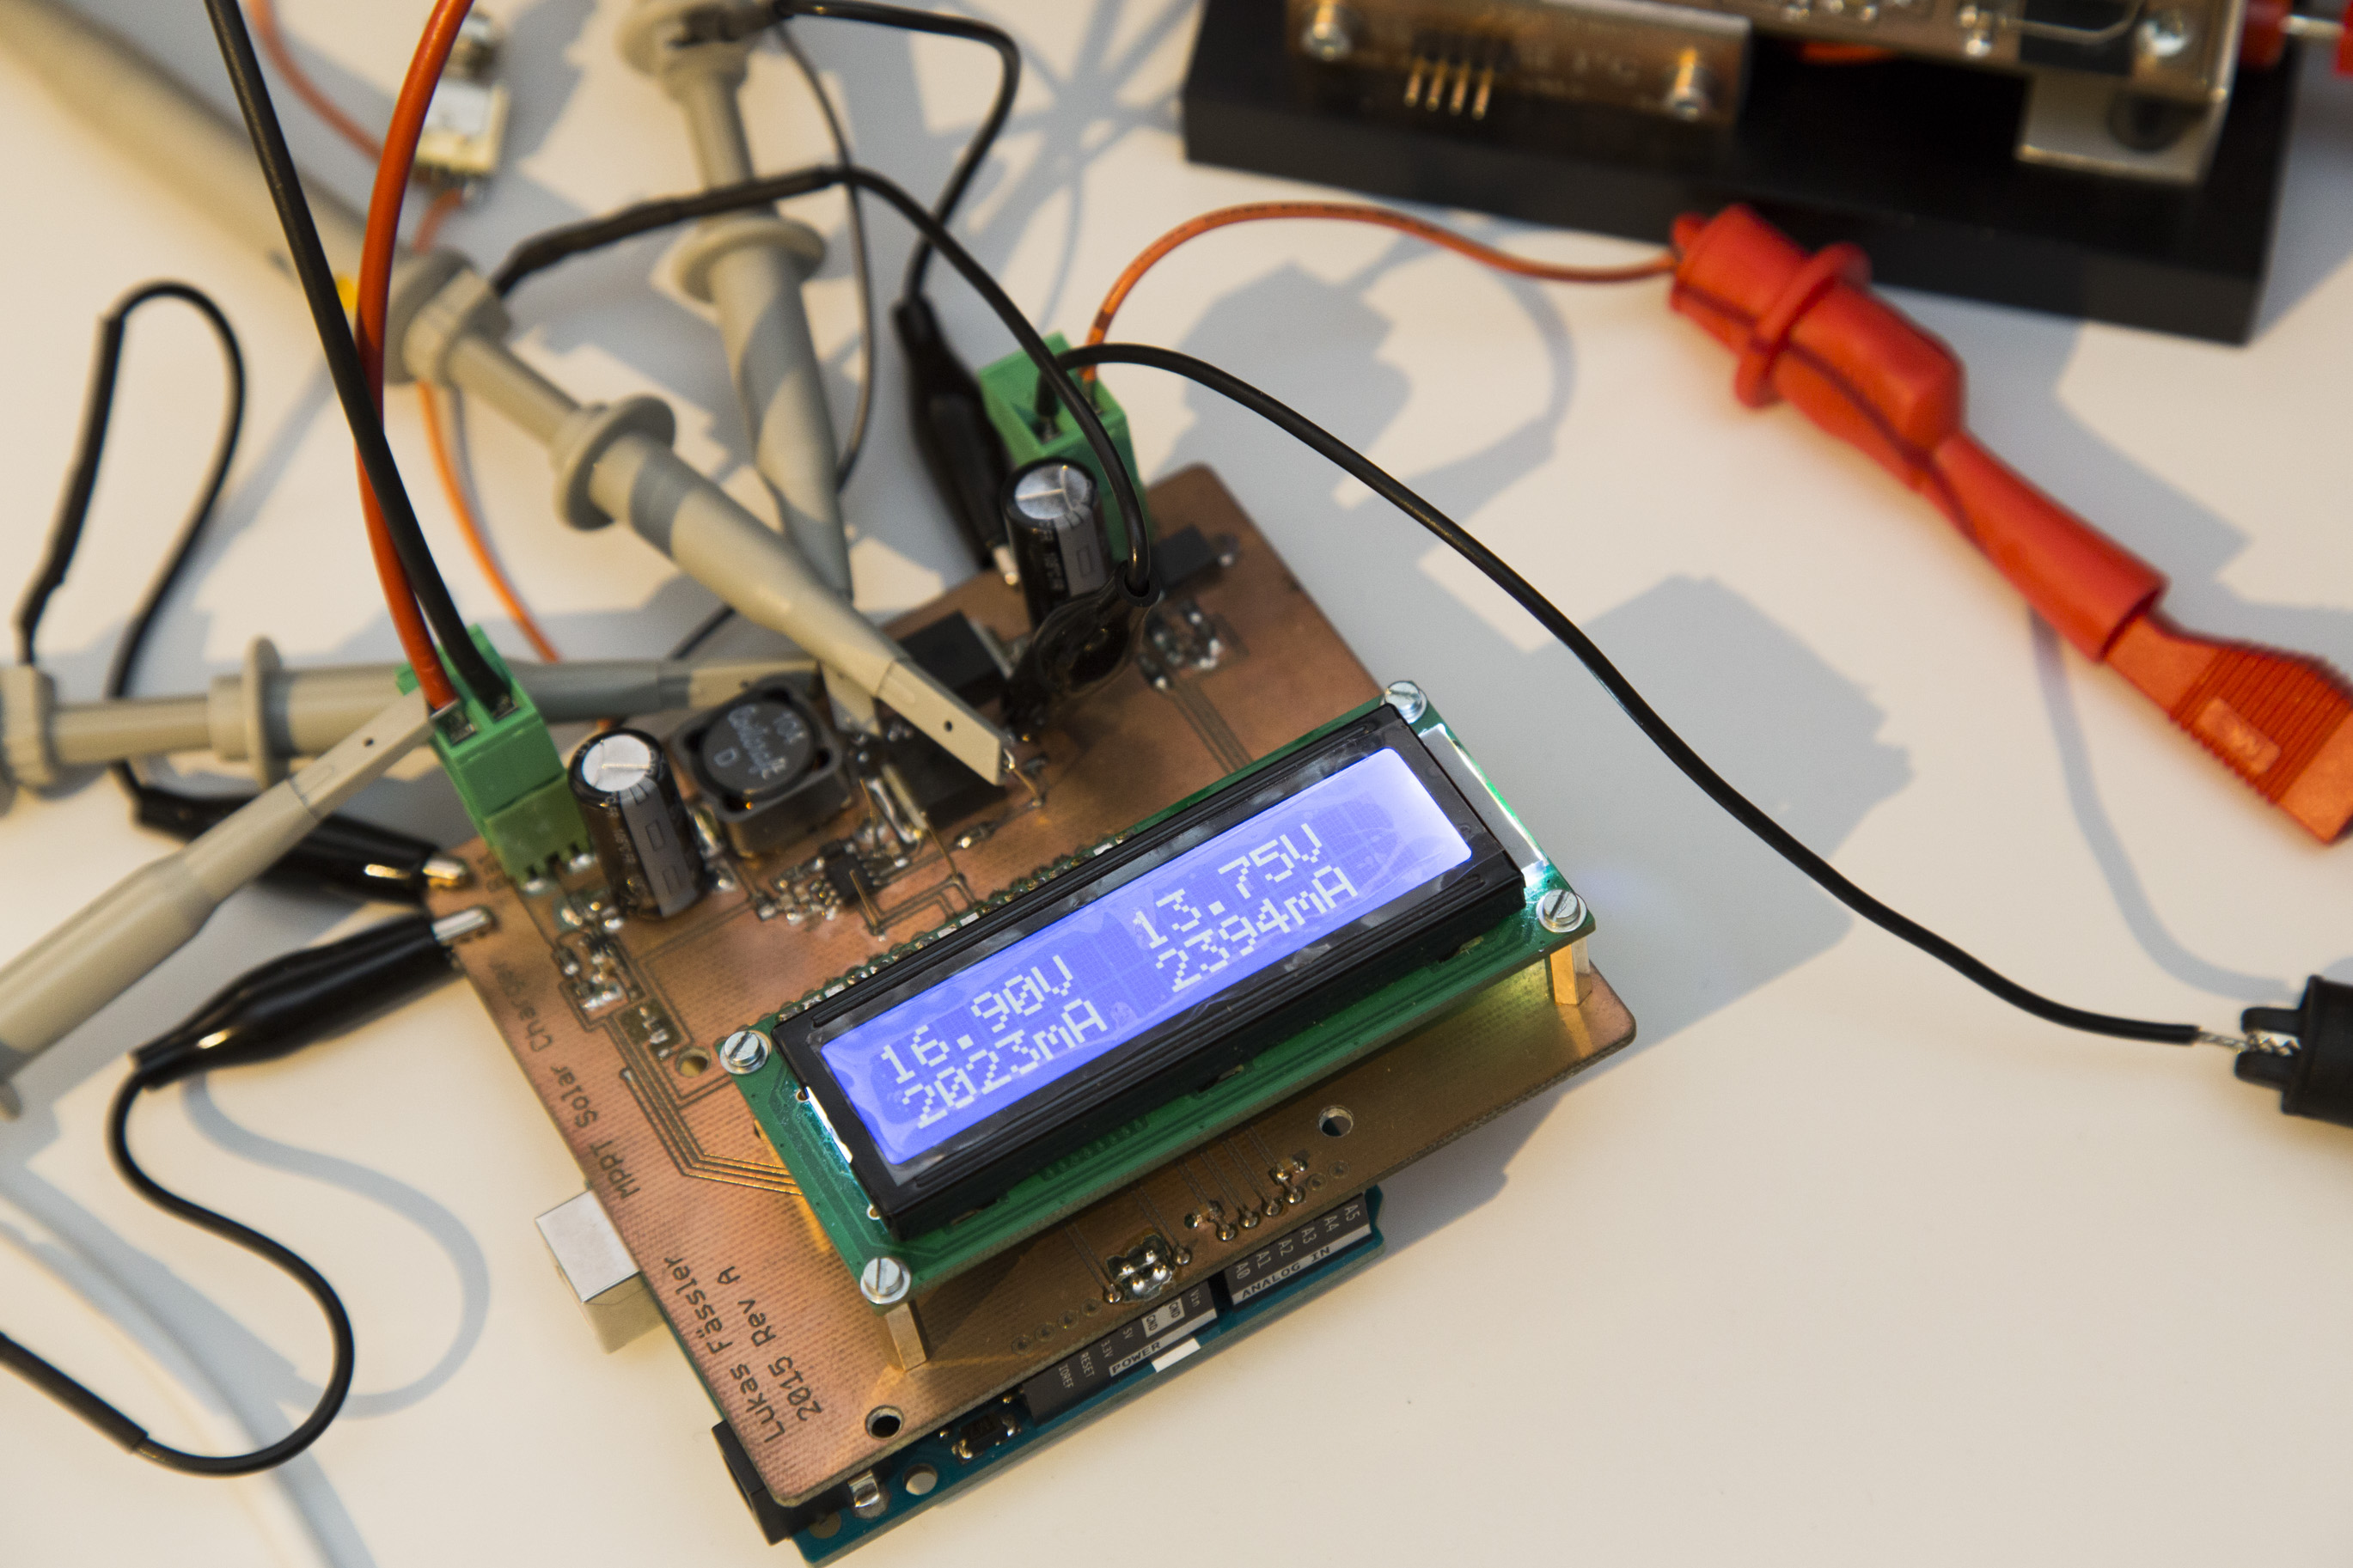
So my function write_display() can focus entirely on formatting. The upper line shows the voltages in Volts, the lower line shows the currents in Milliamps. The input is on the left hand side of the display, the output on the right.
Deciding what to do
In the first section we’ve discussed the functions necessary to controll the DC-DC converter. But in order to use those functions, the Arduino needs to first decide what to do.
66% duty cycle at 21V input voltage gives the desired 13.8V at the output
This is where the function buck_update() comes into play. You could consider this the heart of this sketch. This is where all the relevant decisions are made. When to turn the converter on, when to turn it off, when to increase the duty cycle, when to decrease it… You get the idea.
The behaviour of buck_update() is controlled by 8 #defines. I list them here together with the values I have used:
I think they are quite self-explanatory, especially if you look at how they are used inside buck_update. It’s quite simple: If the panel’s voltage rises above 18V, turn the converter on. Once the converter is on, try to archieve a panel voltage of 17V without exceeding 13.9V at the output. If the panel’s voltage drops below 15V turn the converter off again.
At 55% duty cycle with a 16.9V input voltage we’re getting only around 9.2V at the output
Besides that the function is also looking at the input and output current and makes sure certain limits are not exceeded. But with a 30W panel it should never be possible to reach those limits anyway.
Putting it all together
Now all we need to do in the loop() function is calling read_values(), buck_update() and write_display(). Since writing to the LCD is quite slow we are only doing it every 32nd time we read the values and update the PWM signal.
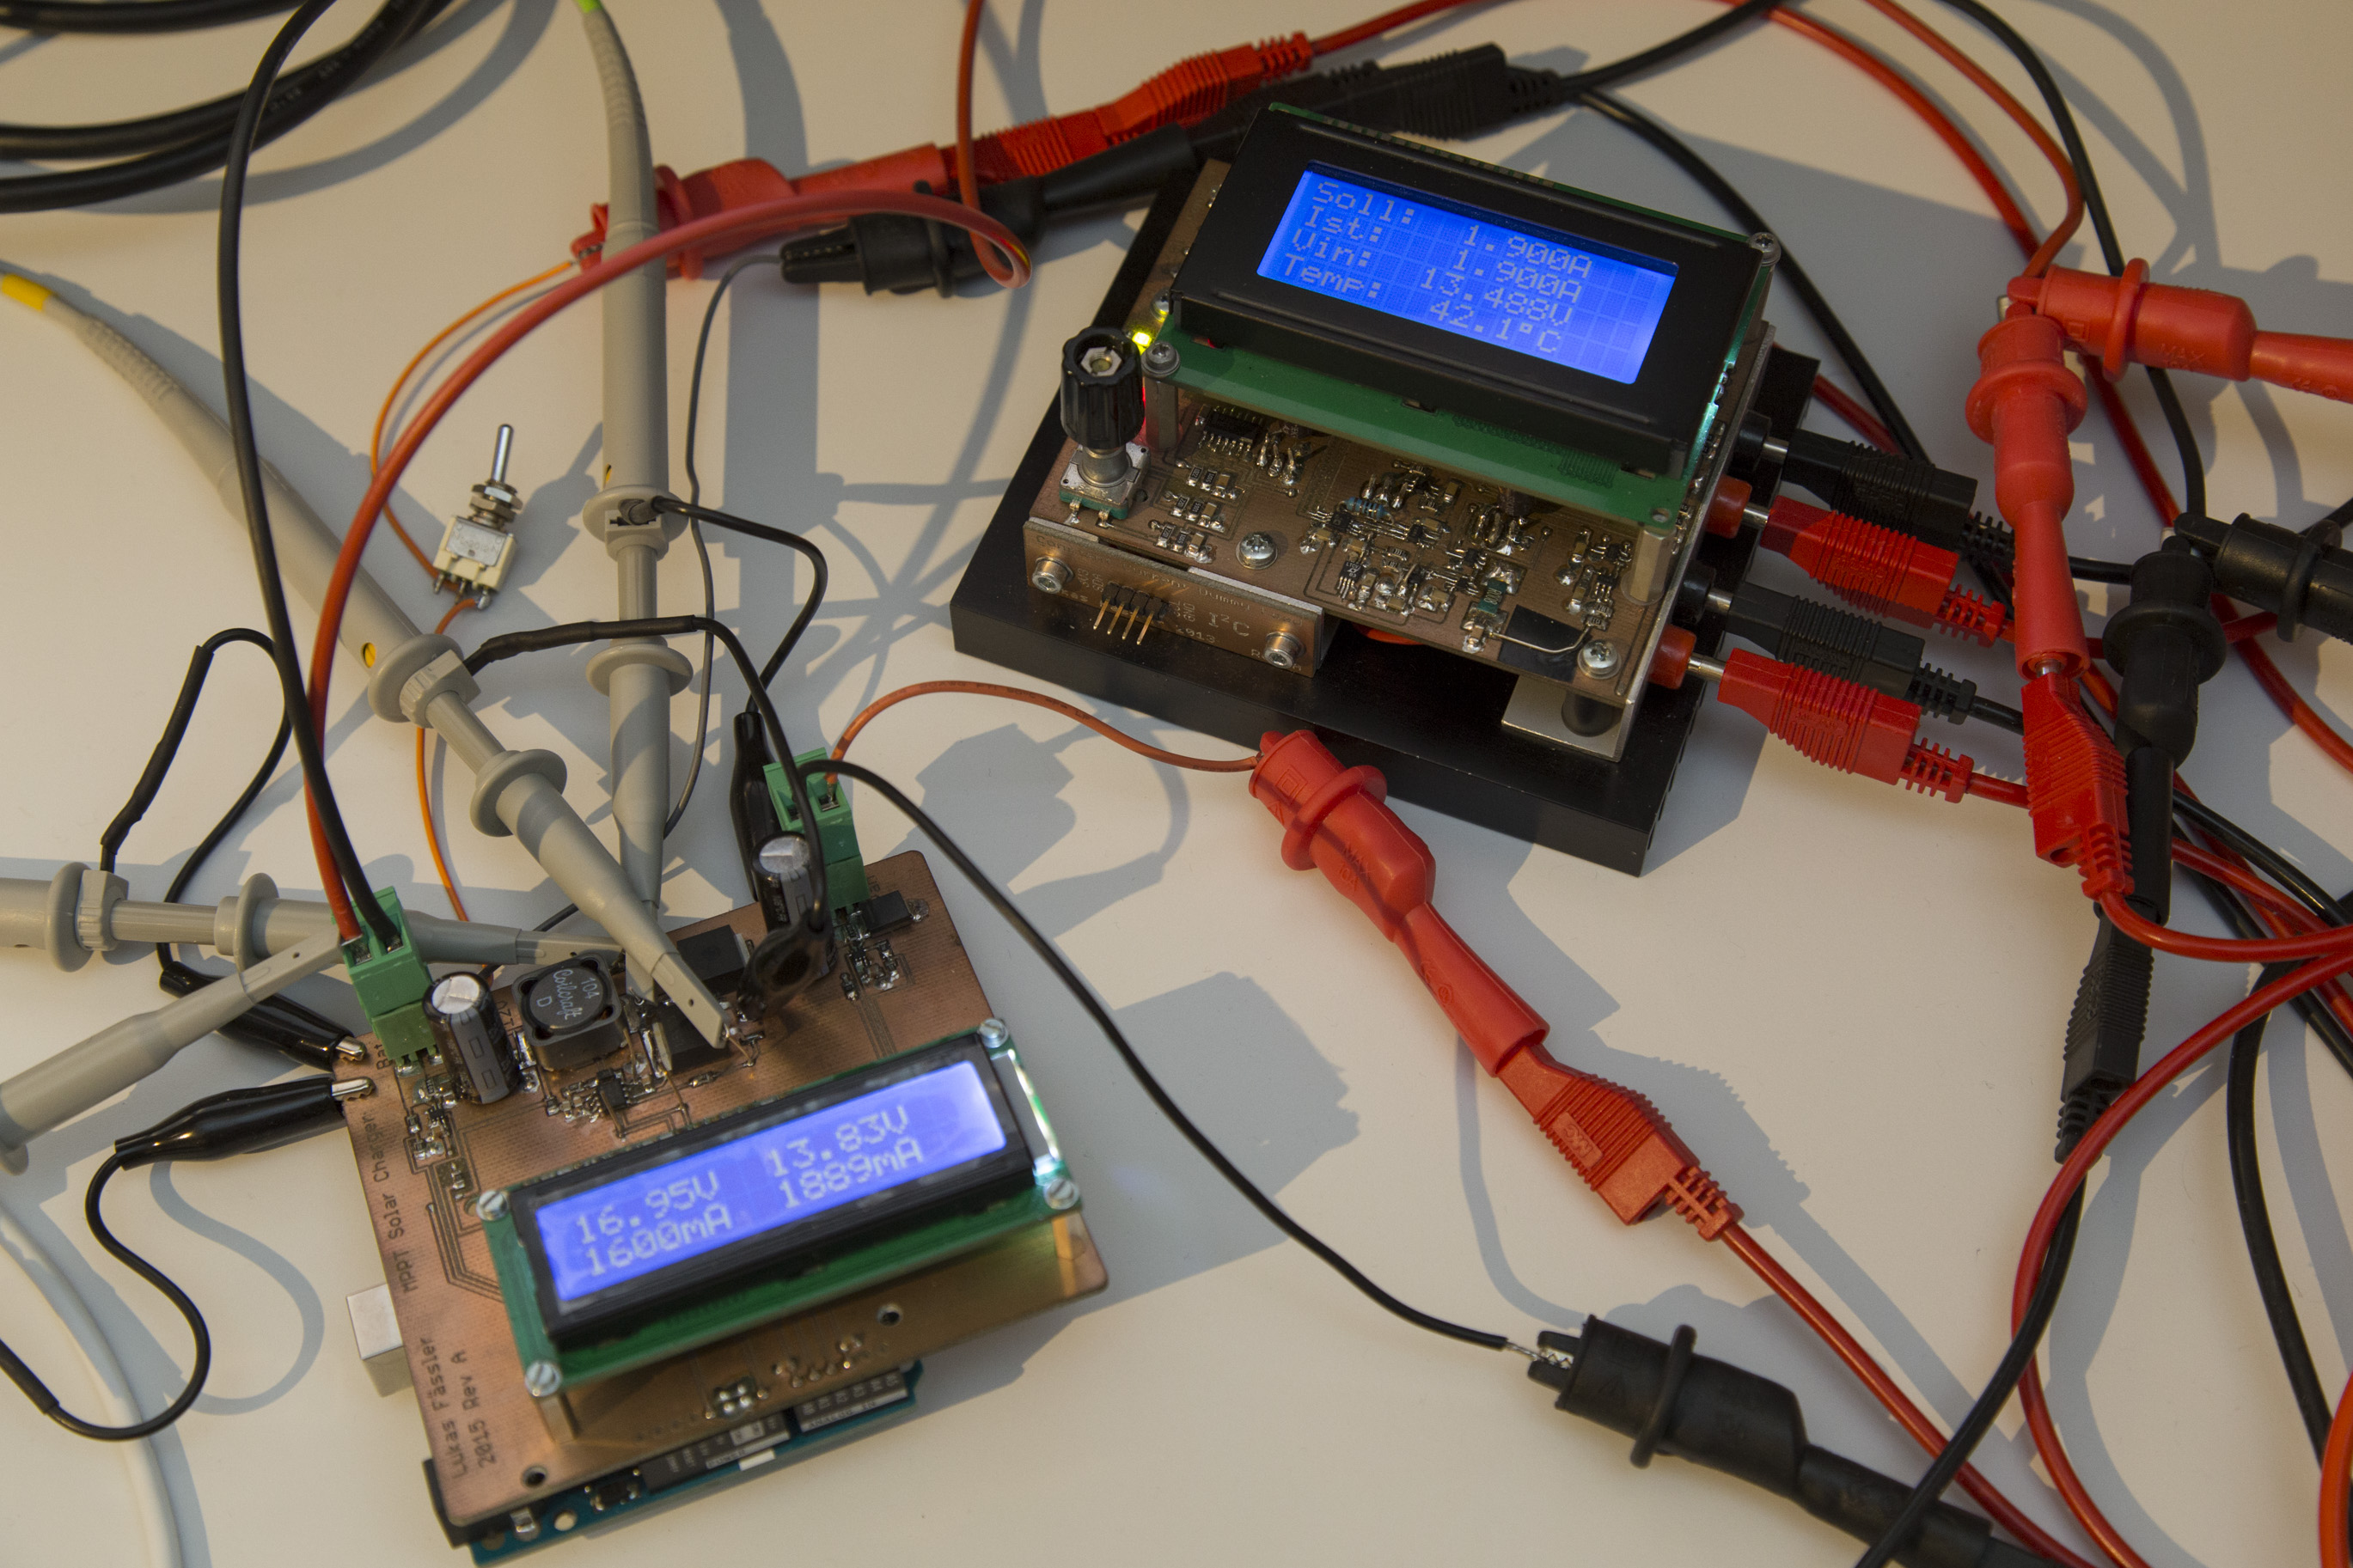
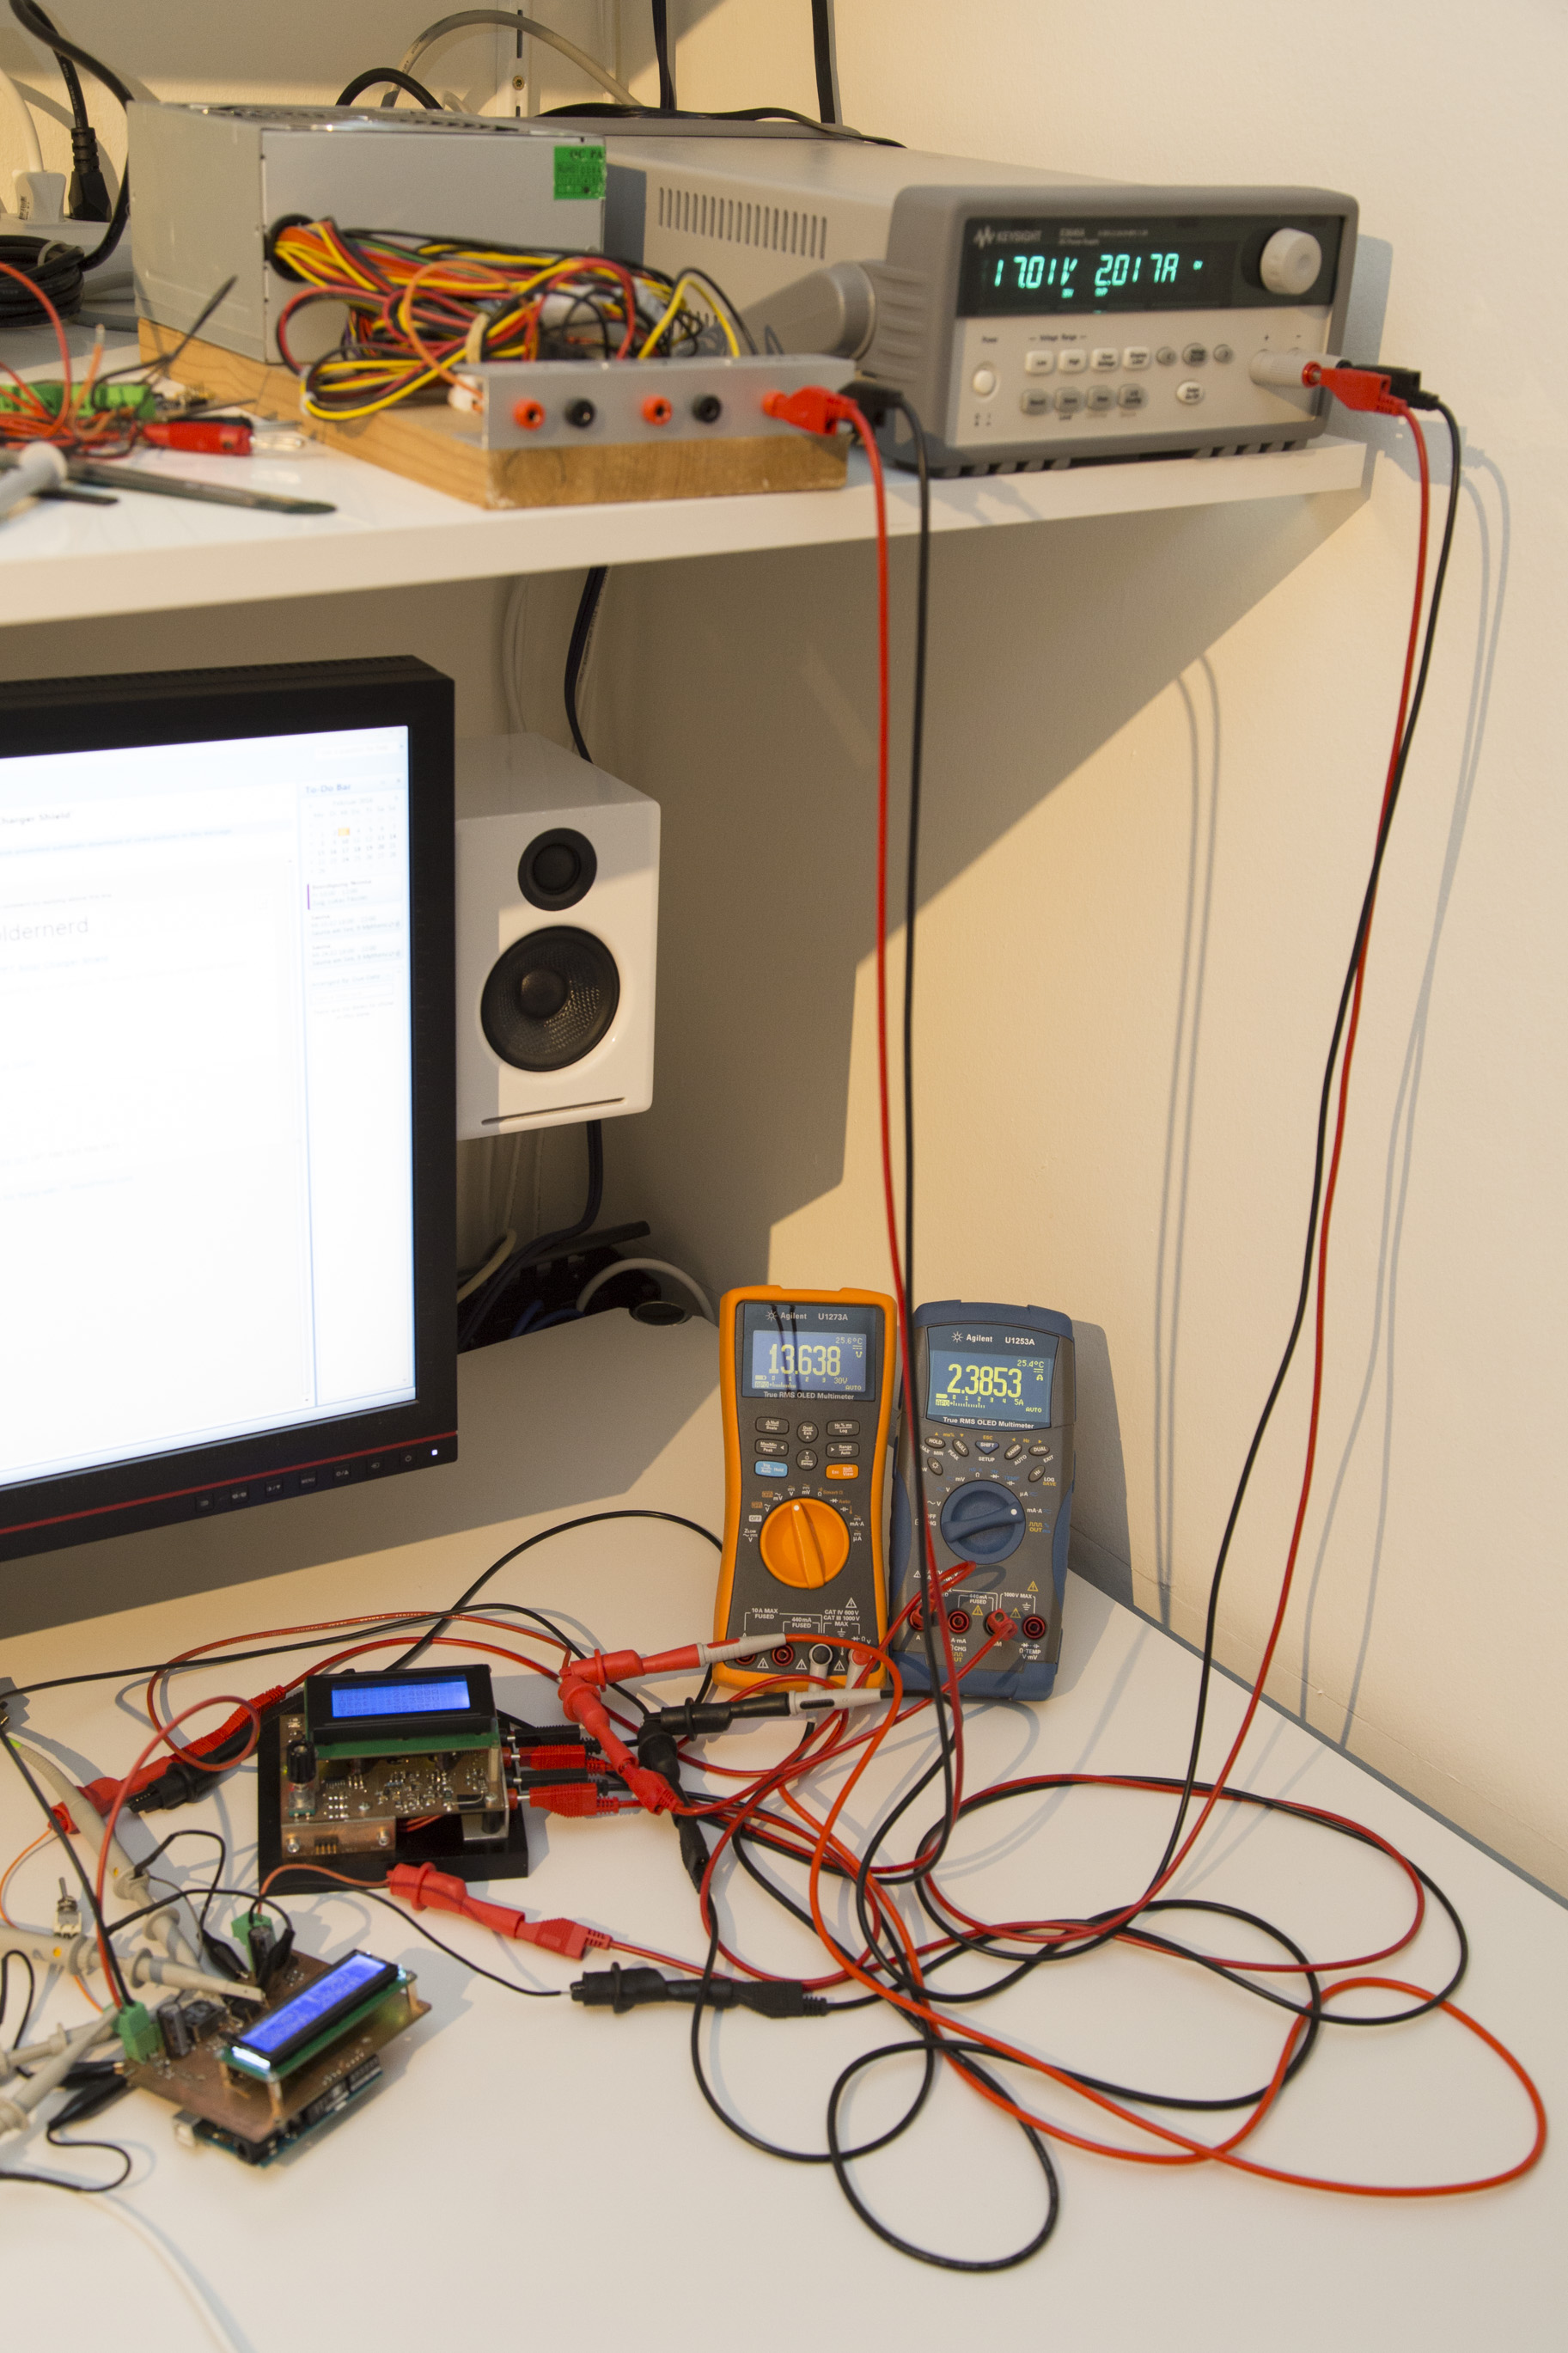
With this sketch I’ve hooked the MPPT Solar Charger up to my lab power supply. (a Keysight E3645A, my newest toy *g*) and my extremely simple but occasionally useful resistor-based dummy load.
The enable and disable voltages are simple and work as expected. Maximum output volage is also not tricky. If the voltage at the output goes too high, the duty cycle is decreased and everything is fine again.
There’s not much to photograph when you’re writing and testing software
More interesting was to see how the shield would regulate when faced with a limited current budget at the input. For that the supply was set to a voltage of 21V (about a 12V solar panel’s open-circuit voltage) with a current limit of 100mA to 500mA. That’s quite a nasty supply, quite a bit trickier to handle than a real solar panel. Try to pull just a bit too much current and the voltage will drop to zero…
Also, the resistors at the output are not a realistic load for the converter. A car battery will pull no current at 12 volts or so (unless overly discharged) but will quickly start to sink large currents when the voltage goes just a bit higher and the battery is charging.
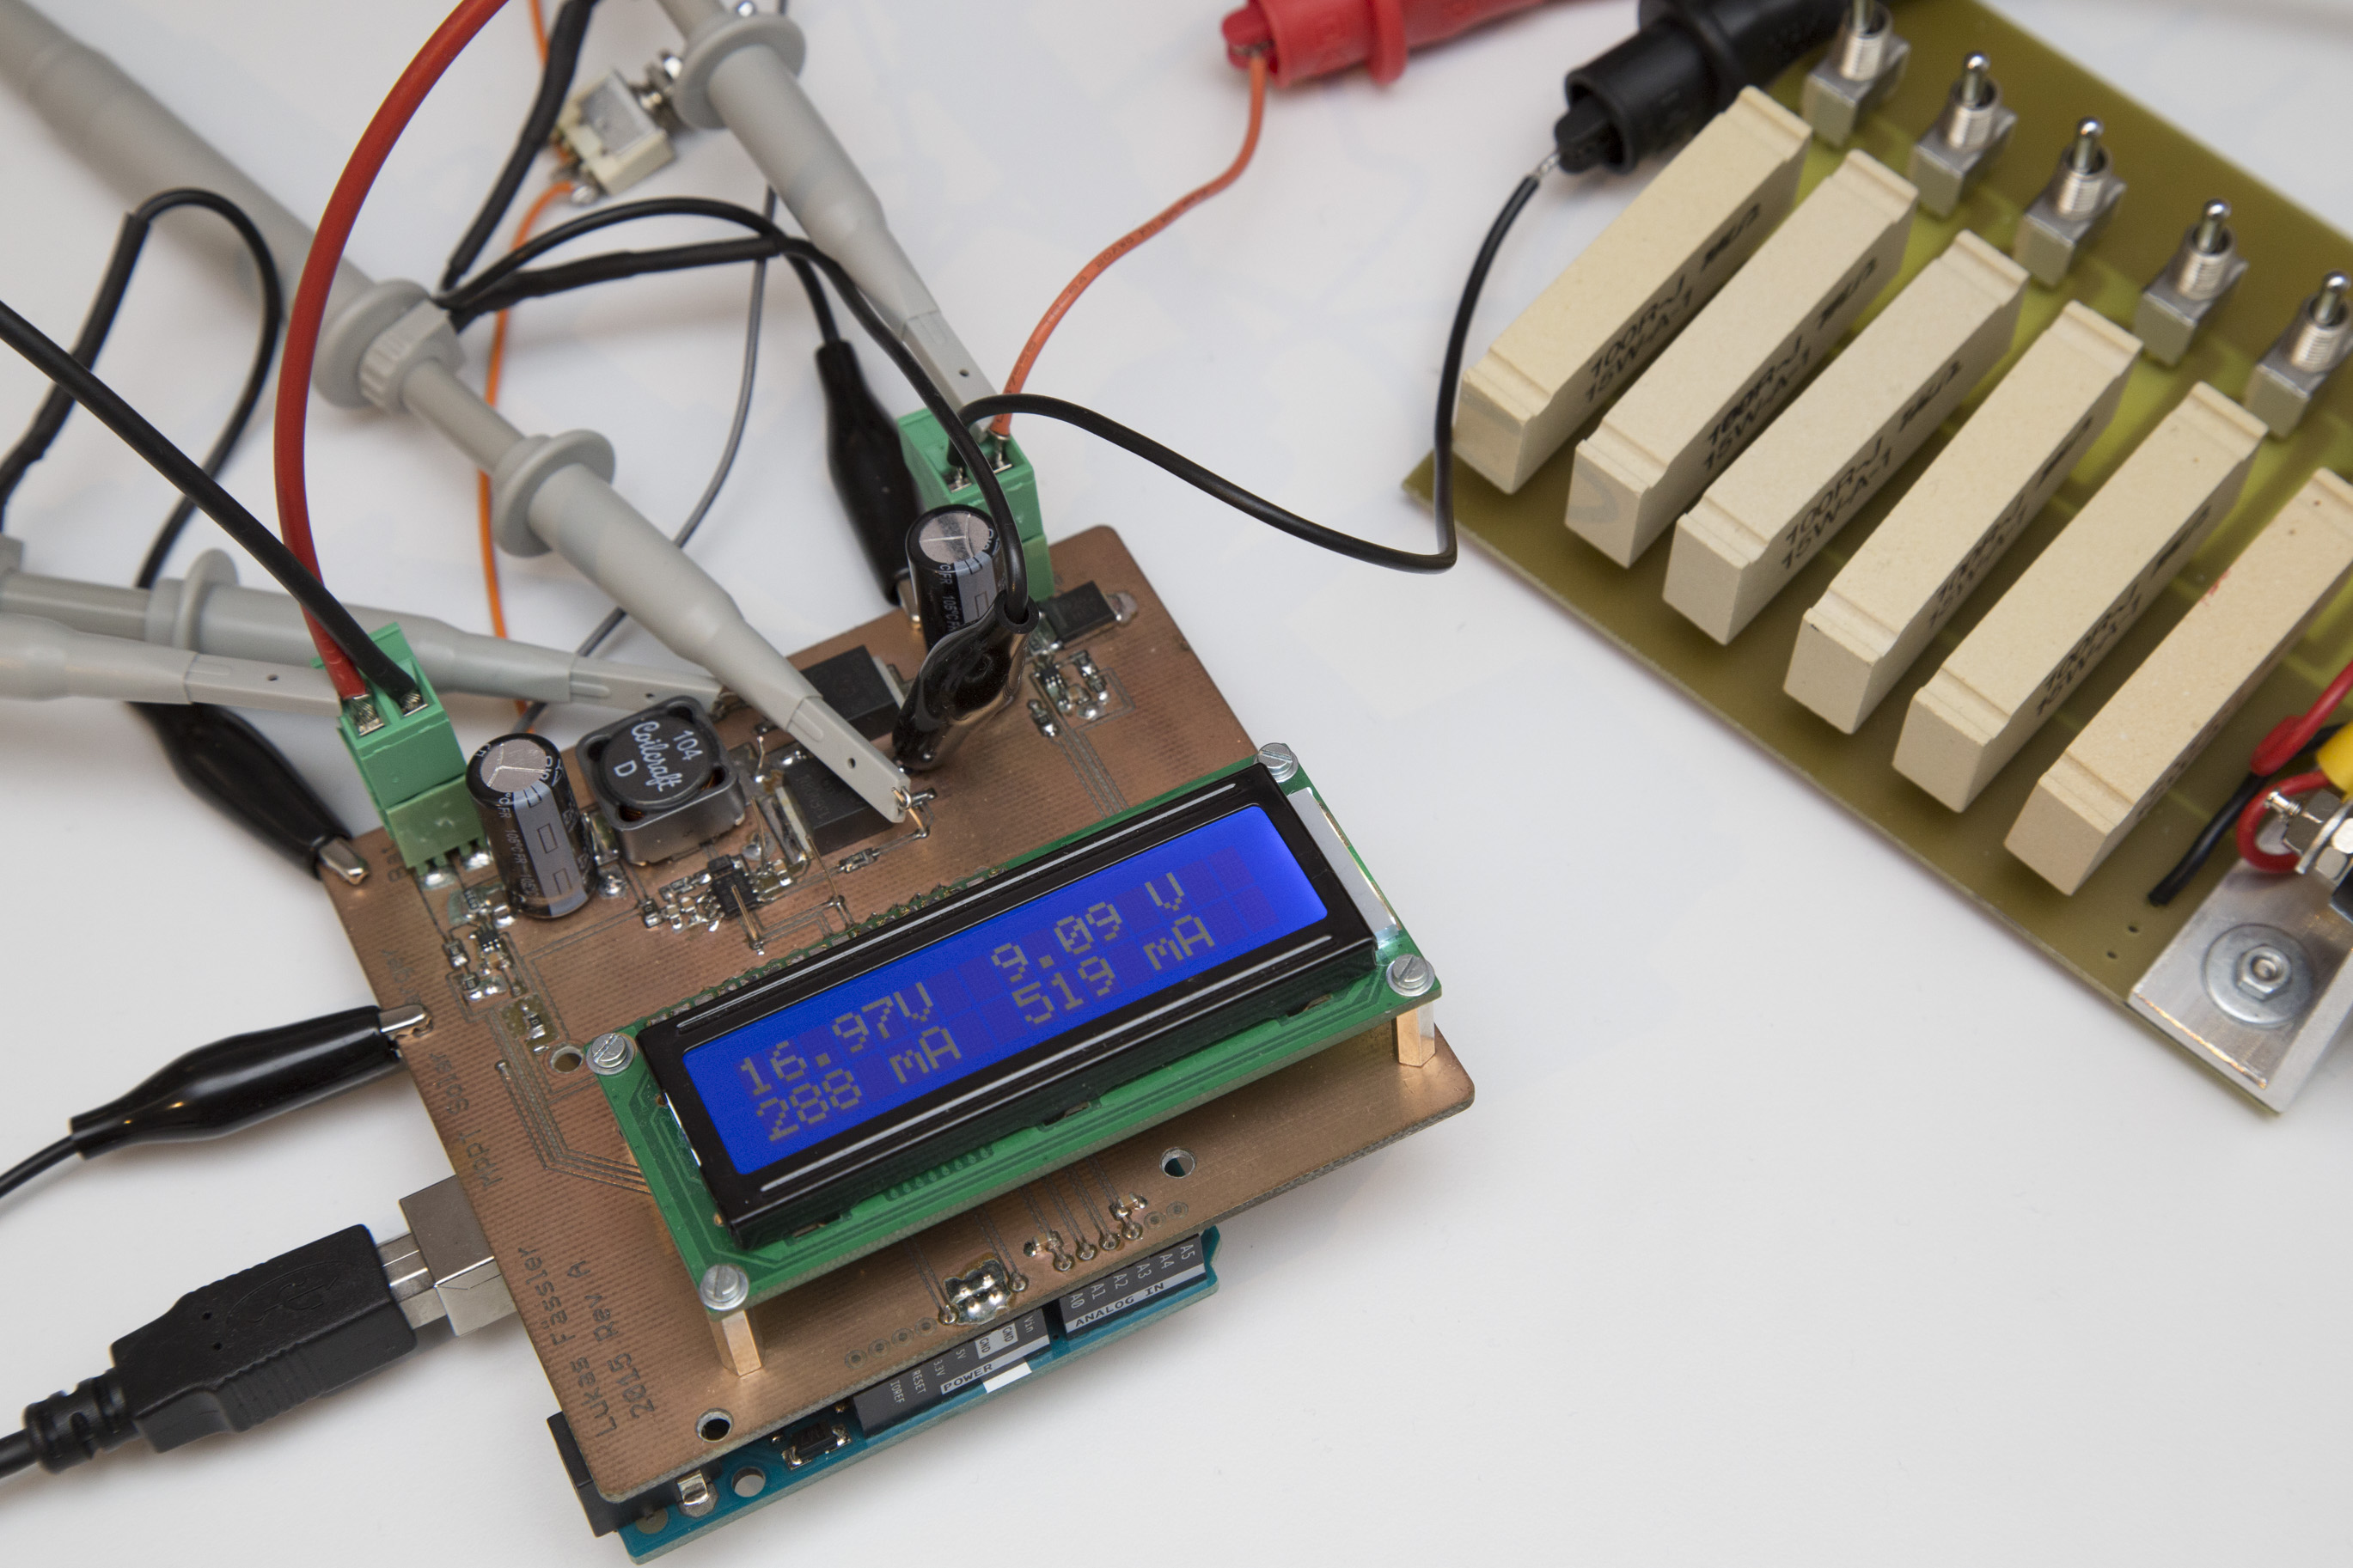
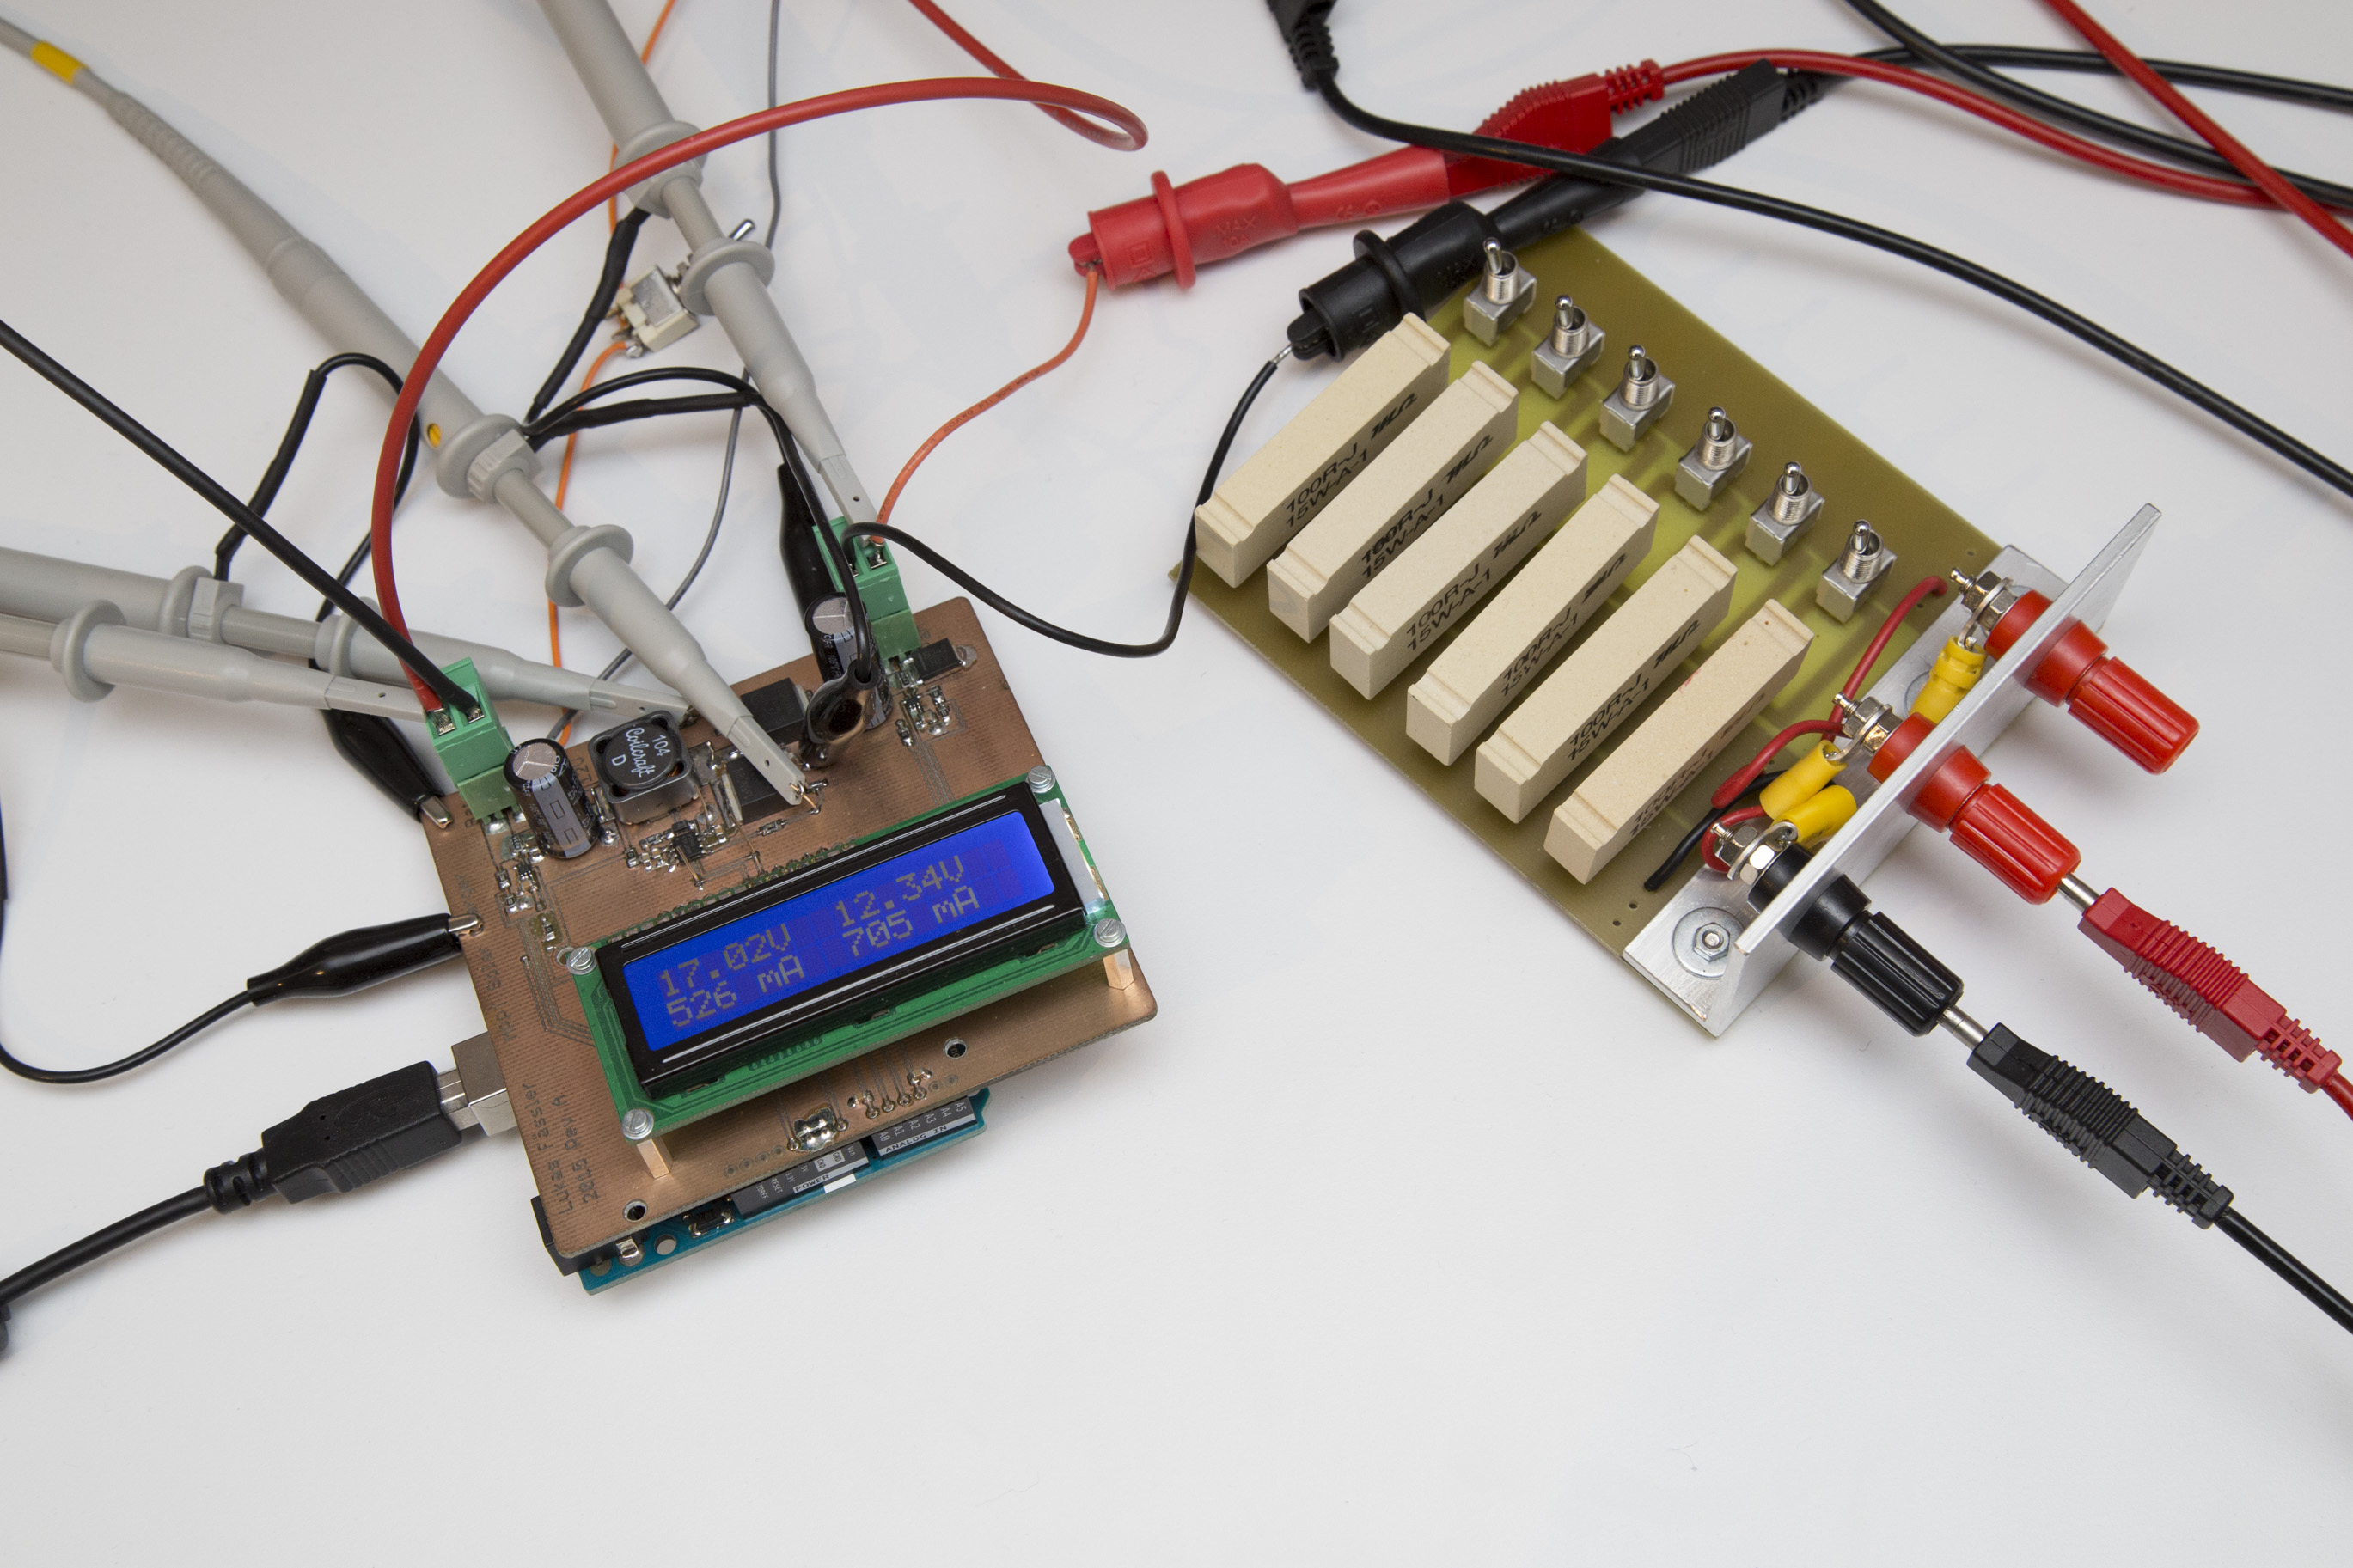
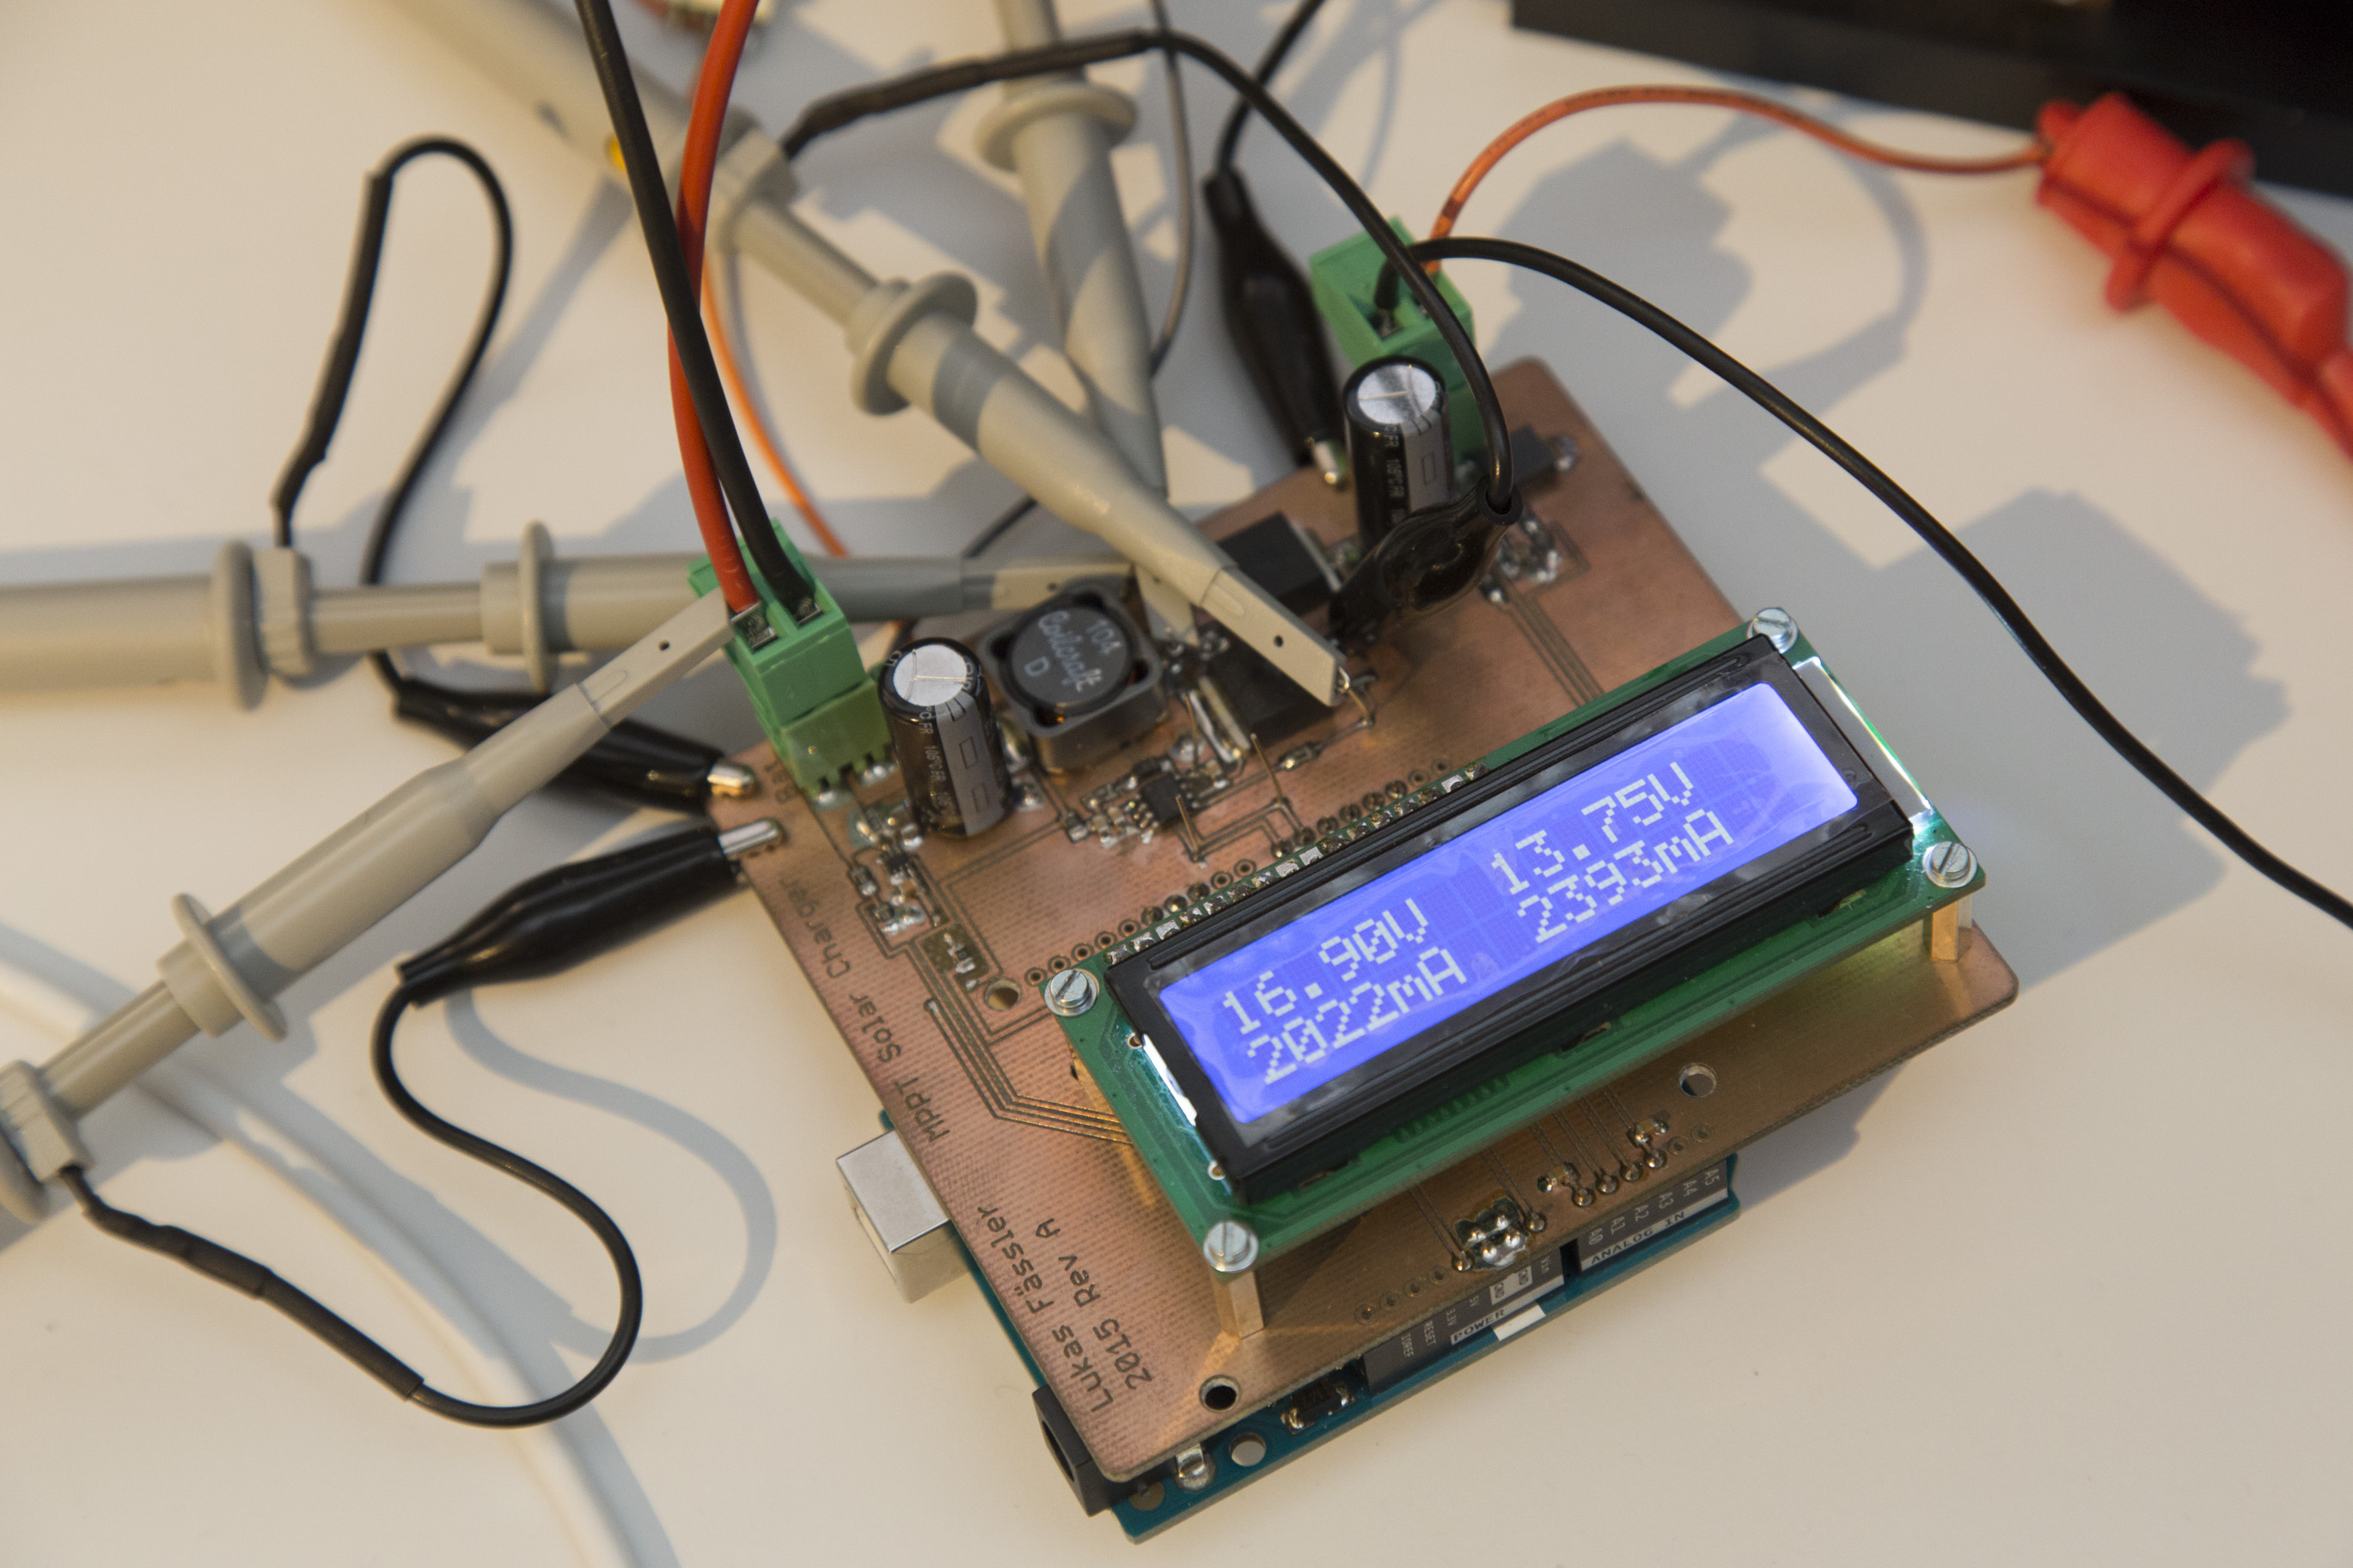
But I think the setup is good enough to test the sketch. And it handles the challenge quite well. With all resistors on (i.e a 100/6 ohms load) and a 300mA current limit, the input voltage sits at 17V (our target input voltage) while 9.25V appear at the output. At 400mA, the output voltage rises to 10.7V with the input still at 17V. At 600mA the input is still at 17V but with the output now at 13.15V. If I take the current limit even higher, the output voltage rises to 13.82V but not any higher, just as we want. The input voltage rises to 21V (since this is a lab supply and not a panel) with a corresponding drop in current to 530mA.
Quite realistic: The charger is pulling as much current as it can with the current limit at 530mA and reaches an output voltage just above 12 volts
I’m honestly quite happy with the project as it is now. The idea definitely works and I’m motivated to design a new, deployable version with some fancy features that will use much less power at the same time. I’ve already done quite some work on that new version but it will take another few weeks until I get to describe that project here.
Until then I will show you some other, smaller projects that I’ve already finished but didn’t have time to document yet. So you will first see a number of smaller, simpler projects over the next few weeks.
First tests are being performed on the Solar Charger Shield
In my last post I’ve introduced a proof-of-concept Arduino solar charger shield. I went through the hardware as well as the way it works – or at least is intended to work. It was prominently linked on dangerousprototypes.com as well as some other sites and got quite a bit of publicity as a result. Thank you all for sharing this post.
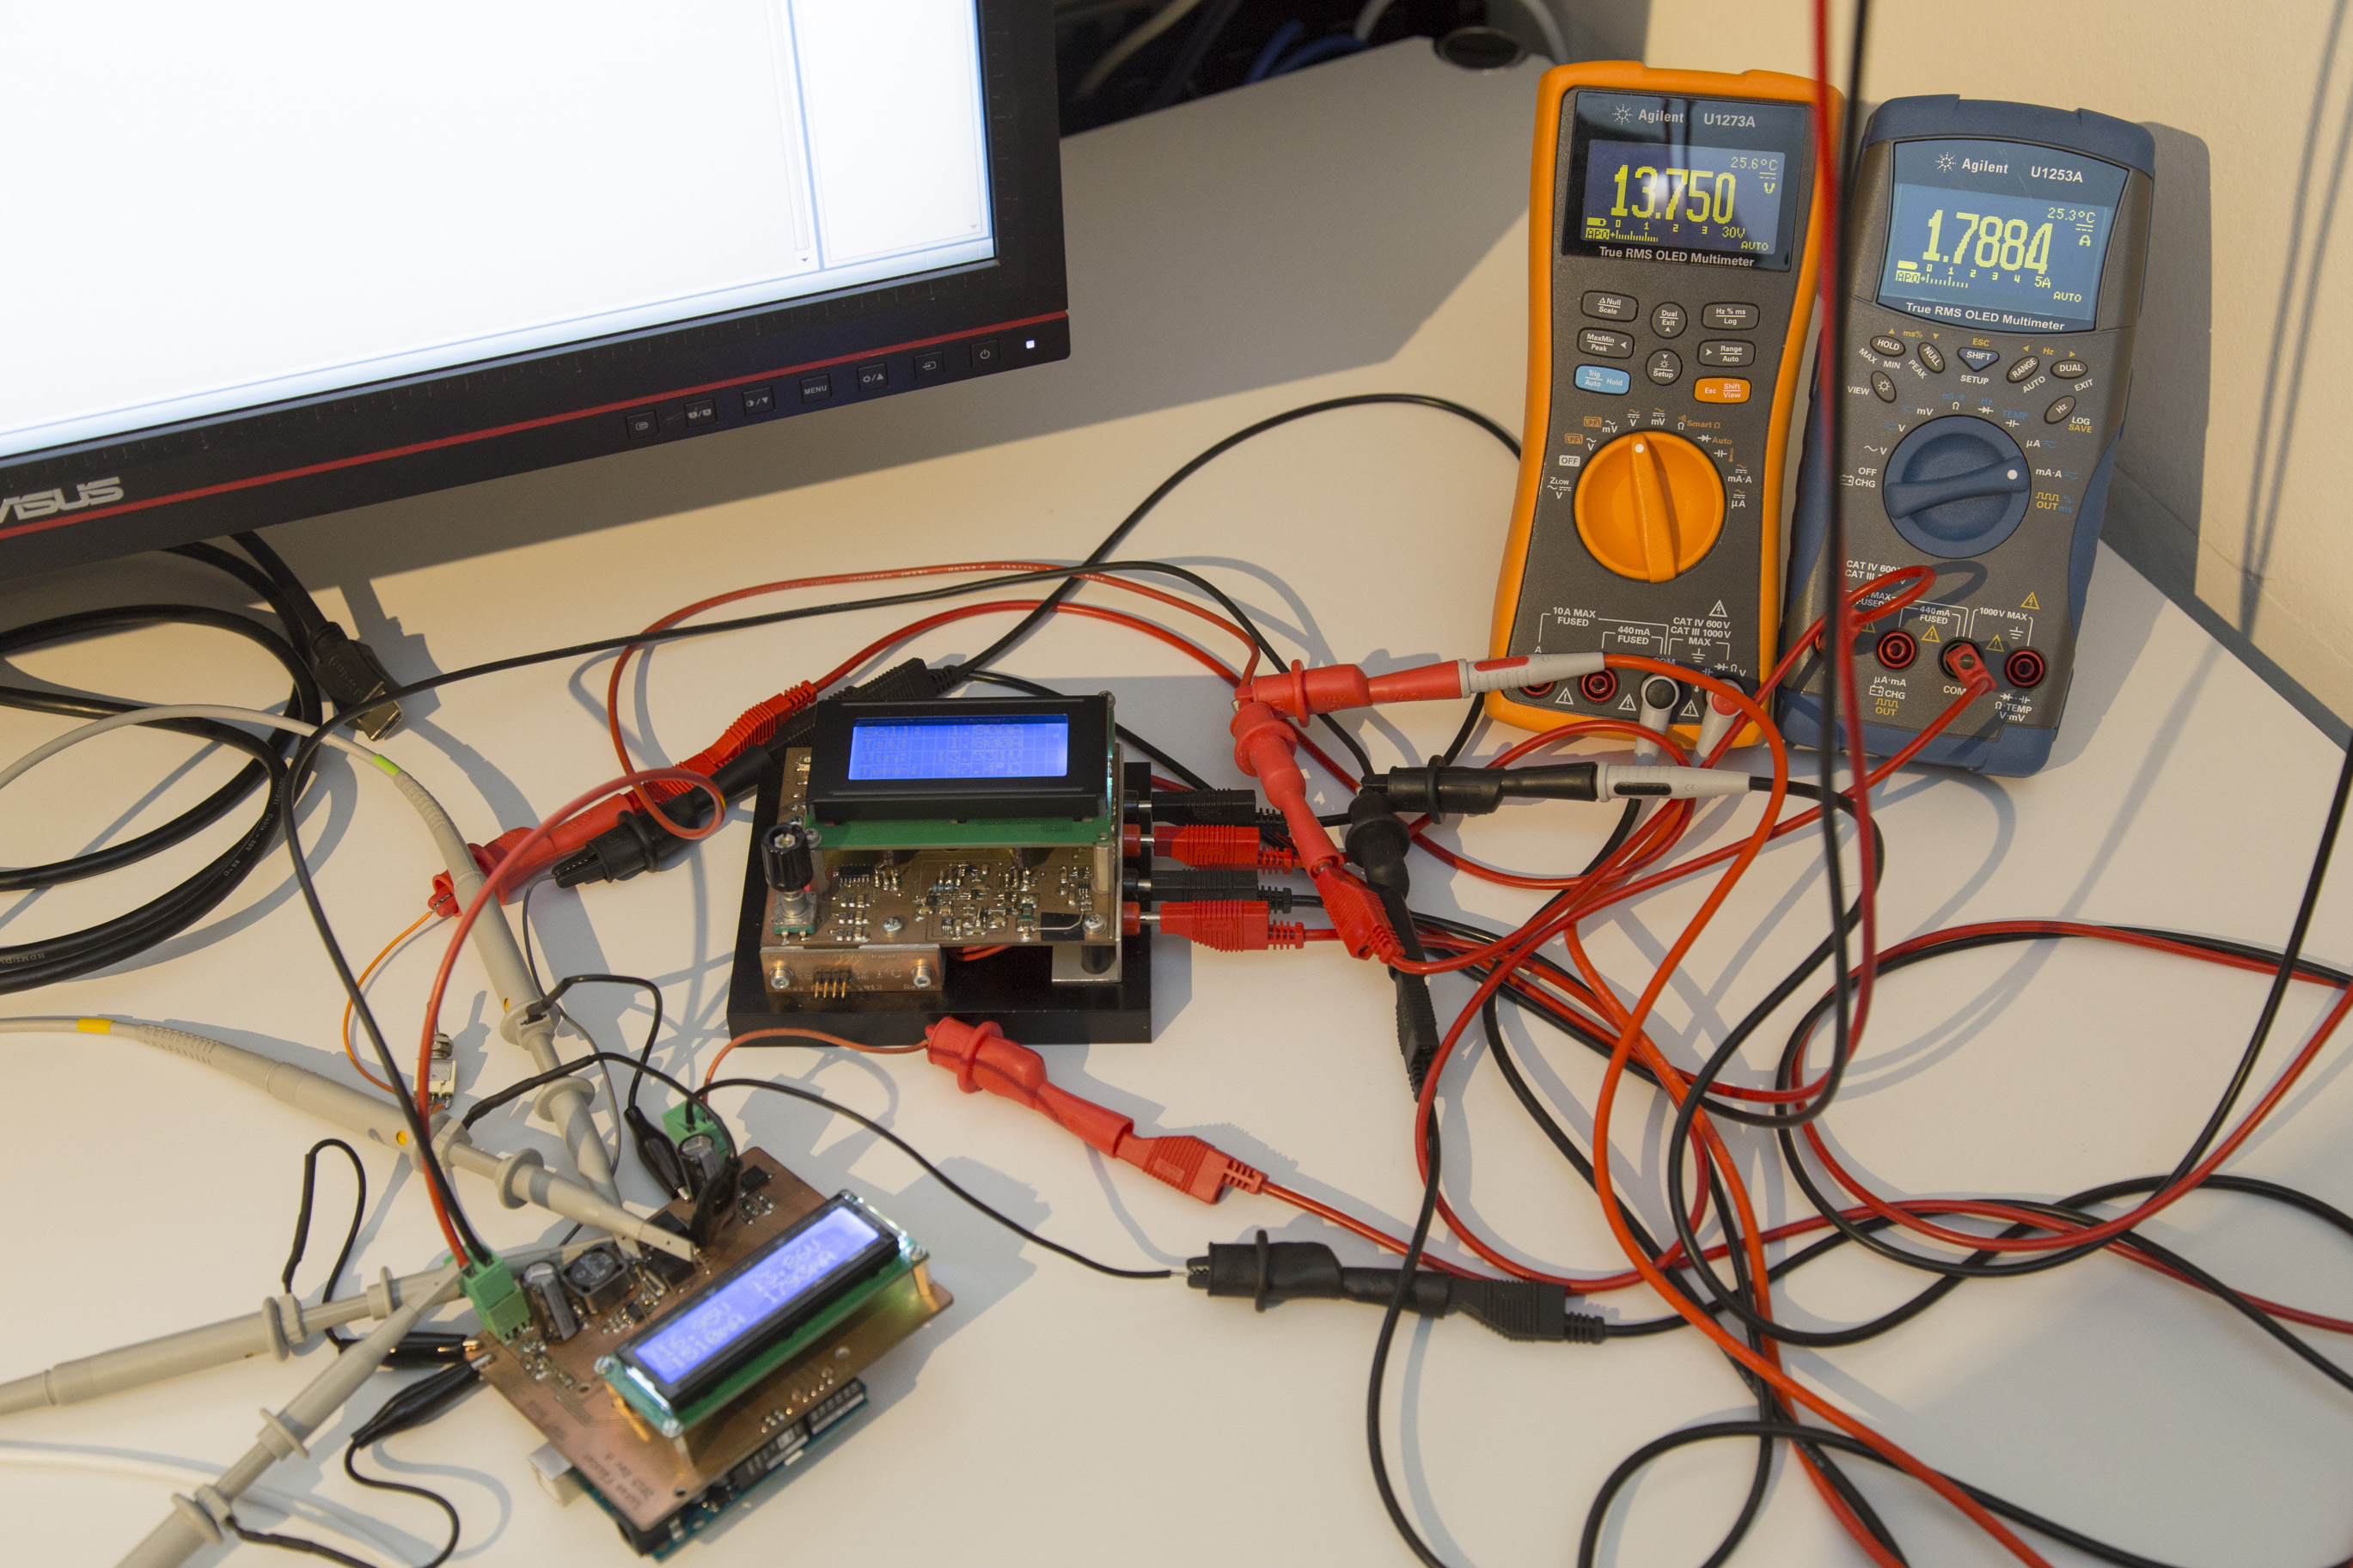
This time I’ll show you some results of the testing that I’ve done. The basic test setup is shown above: The solar charger is hooked up to my home-brew constant current dummy load, together with a pair of DMMs at the output in order to precisely monitor output voltage and current. For the input I’m relying on the lab supply to provide these measurements. And yes, the shield does its own measurements of both input and output currents and voltages. Once calibrated they are even quite accurate but I won’t rely on them for things as calculating the converter’s efficiency.
Vin=17V, no load
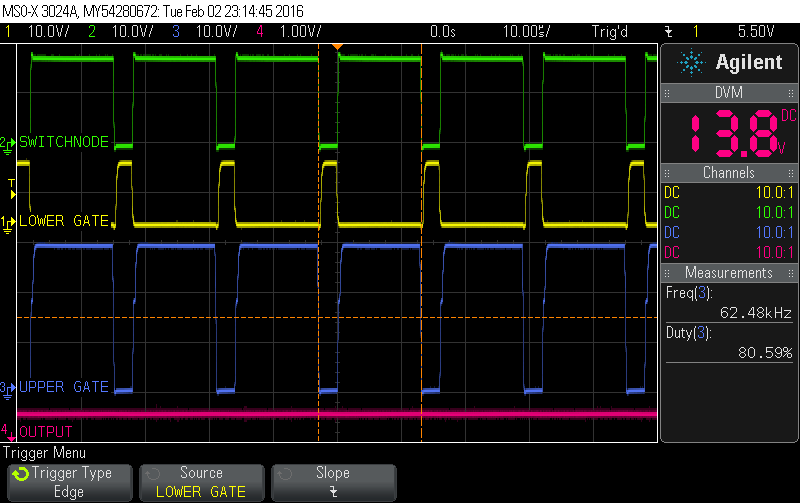
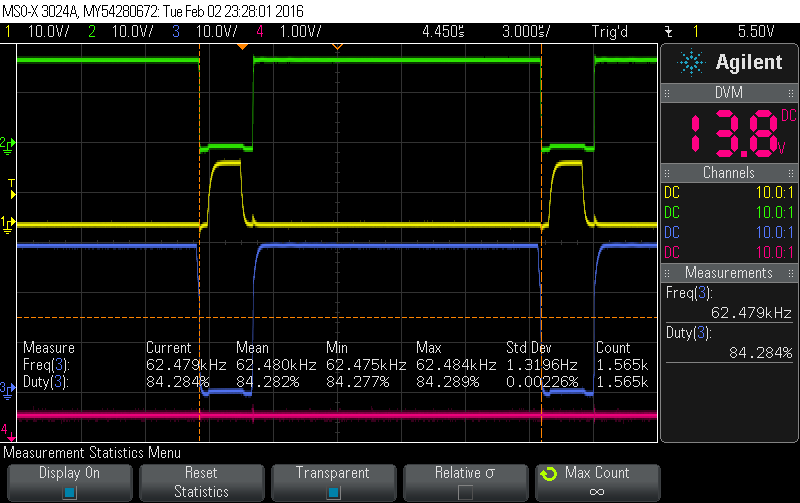
But first we need to see if our converter works at all. As the scope screenshot above demonstrates – it does. For all the tests shown in this post, the input voltage was provided by a lab supply set to 17 volts. So we’re not yet testing the software and its capability to draw just the right amount of current.
Vin=17V, no load
As you can see, since the converter can draw any (reasonable) current at the input, it provides the maximum voltage (set in software) of 13.8V at its output. In order to do that, the upper FET is on approximately 80% of the time. The signals all seem nice an clean and there is no noticable ripple at the output at 1V/div and no load. And the switching frequency is 62.5kHz (16MHz / 256) as expected.
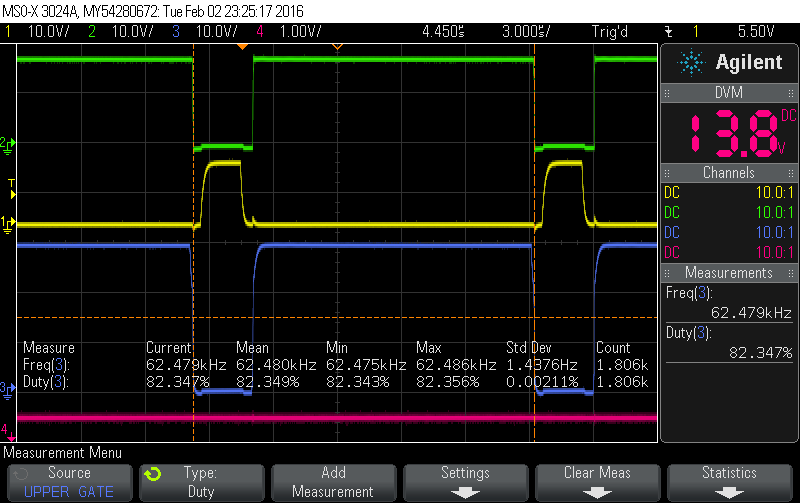
Vin=17V, Iout=1A
At 1 Amp output current, the software has to increase the duty cycle somewhat to 82% (above) and even further to 84% at 2A (below). Besides that, everything still looks very similar under load conditions.
Vin=17V, Iout=2A
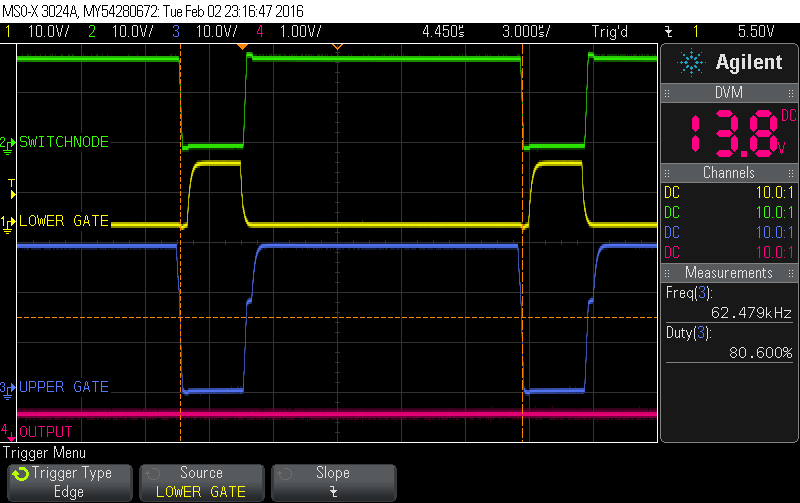
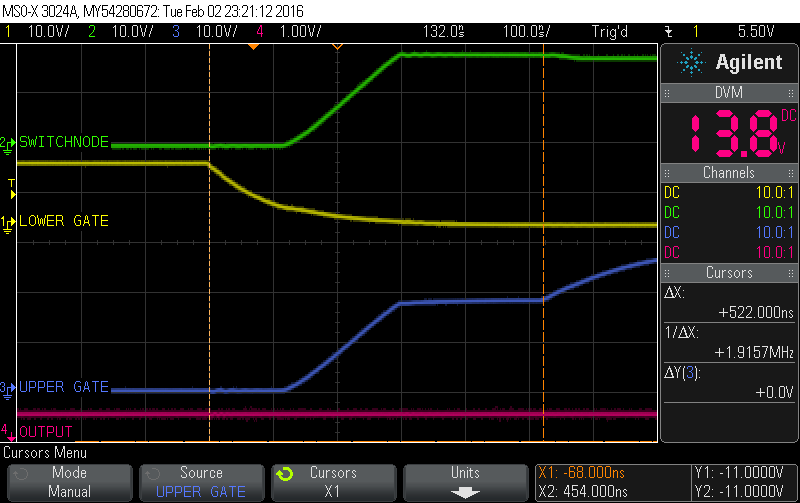
In my last post I’ve raised the question if the FET driver’s dead time of 540ns according to the datasheet is not a bit excessive. Well, let’s look at the dead time on the scope. First of all we can observe that the dead time of the IR2104 is in line with the data sheet. I don’t have it in front of me right now to check the min/max specs but the measured 522ns seem reasonably close to the theoretical 540ns.
The IR2104 has a built-in dead time of 540ns according to the data sheet. We’re measuring 522ns here – close enough.
From looking at the screen shot above, the dead time does seem a bit long. The reason dead time is introduced is to prevent shoot-through. If both FETs are on there is a short-circuit from the input to ground. Together with the input capacity and the FETs low Rds-on, very large currents could flow, possibly destroying the FETs and at least detoriating efficiency. So introducing a bit of time when both transistors are off seems reasonable. But too much of it also costs efficiency since current has to flow through the diode instead of the lower FET. The main reason for using a synchronous topology is to prevent this in order to gain efficiency. So obviously one has to find a balance. I think here we’re a bit far on the conservative side but never mind for now.
Let some current flow
So now that our converter is working, let’s take a look at efficiency. I’ve measured the efficiency at output currents ranging from 100mA to 2.6A in 100mA steps with the input voltage at 17V. I didn’t use the sense-wires connections on the lab supply so I had to compensate for the voltage drop on the input leads manually.
There was a drop of up to 220mV on the input leads so the voltage reading of the lab supply is not quite accurate
The results are quite impressive:
95.5% @ 100mA (worst)
96.9% @ 200mA
97.9% @ 400mA
98.1% @ 800mA (best)
97.1% @ 1600mA
95.7% at 2600mA
So the efficiency is constantly at a very high 95.5% and better over the entire current range of interest.
This little dummy load is really useful
The resulting loss is less than 1.6 Watts @ 2.6A out. As a result, the shield never gets hot, even when running at this power level for a while.
Note that this is quite a bit more power than the converter was designed for. 37W as opposed to the 30W I designed it for. The FETs could even handle much more. The limiting factor would likely be the coil reaching saturation. Unfortunately my lab supply doesn’t supply any more than 2.2A so I can’t push it any further.
Shield performs well even beyond 30W spec
One thing to note is that these efficiency figures don’t take into account the power consumed by the arduino, the display, the fet driver, current monitoring ICs and so on. This brings us to the last topic for now: The current consumed by the various components. I did these measurements mainly in order to understand how to limit power consumption in a later version. To me, this shield is only a proof of concept and so reducing power consumption was never an issue.
Basic test setup
Here are the results:
Arduino: 48.7mA
LCD backlight: 8.9mA
LCD excluding backlight: 1.148mA
FET driver (standby): 106.56uA
FET driver (62.5kHz, Iout=0): 2847uA
FET driver (62.5kHz, Iout=2.5A): 2937uA
Current sensors (each): 48.6uA
So the arduino itself is using up the lion’s share of current. Next comes the LCD backlight. Nothing unexpected so far. The LCD without backlight still consumes a considerable 1.15mA, no matter if it’s on or off. The FET driver uses around 2.9mA when on and only about 0.1mA when off. Output current only has a minor impact. The current sensors don’t use up much – less than 0.1mA for both.
Check out my next post for a closer look at the software or here for an overview over this project.
A friend has approached me regarding his solar project. He wants to install a solar panel together with a battery and an inverter in order to have power at his allotment garden. He had looked at a hobbyist project where an arduino was used to build a MPPT (maximum point of power tracking) charge controller. I took a look at the design, liked a lot of what I saw and decided to build something similar.
The basic idea behind an MPPT solar charger is simple. A solar panel has a certain voltage (in the region of 17 to 18 volts for a 12 volts pannel, somwhat dependent on temperature) at which it provides most power. So as long as the battery needs charging, you want to pull just as much current to reach this voltage. But once the battery is full you need to avoid overcharging the battery. So you want to maintain a maximum voltage for your battery (somewhere around 13.8 volts for a 12 volt lead acid battery) and no longer care about the pannel’s voltage.
So the charger needs to convert an input voltage of 17-18V to an output voltage of 12-14V as efficiently as possible. Obviously, a step-down (aka buck) switching converter is ideally suited for the job. However, a typical DC-DC converter is designed to maintain a stable voltage at it’s output, independent of it’s input voltage. As described above, our requirements here are different.
Switching converters are controlled by the duty cycle of a (typically) fixed-frequency PWM signal. So a microcontroller could be used to do the job. In most applications, this wouldn’t work that well because a microcontroller would be too slow to react to sudden changes in load or input voltage. But this is not much of a concern in our solar application: Sun intensity changes within seconds at best and the battery will absorb any sudden changes in load. So if we adjust our duty cycle a few times per second we’ll be more than fine. And that’s easy to do with a microcontroller.
The next step was to figure out at which frequency to run our converter. An arduino runns at 16MHz. At a 8-bit resolution, this gives us a maximum PWM frequency of 62.5kHz. That’s a pretty slow speed for a switching DC-DC converter nowadays. Most modern designs run in the hundreds of kHz to a few MHz. The main reason of using higher and higher switching frequencies is size. The higher the frequency, the smaller the inductor can be. For us, using a somewhat bigger inductor is totally acceptable. And in terms of efficiency, a lower frequency is even preferable since it reduces switching losses.
The project here is intended mainly as a proof on concept. I expect it to be fully functional but it will consume quite a bit of power while sitting idle. The display (including backlight) is always on, the same goes for all the other components. But the main drain on the battery will be the Arduino itself which consumes around 50mA when running at 16MHz. That might not sound like much but it will add up during the many hours the solar panel doesn’t produce any power. The system will be installed in Zürich, Switzerland so you can’t count on having 8 hours of sunshine every day. In winter, there might be snow on the panel, preventing it from producing anything for weeks in an extreme case. So a productive system should draw hardly any current (say <1mA) when not doing anything useful.
At least for now, the we’ll be using a 30W 12V monocrystaline panel and a 45Ah car battery. So I’ve scaled this converter to comfortably handle 30W input power which translates to about 1.8 amps at the input and 2.5 amps at the output.
As deba168’s design, I’m using a synchronous buck topology. If you’re new to switchers, you might want to check out this wiki page. If you’re serious about designing your own you might want to read Sanjaya Maniktala’s ‘Switching Power Supplies A – Z’, it’s a great book. I’ve also read his other two books on the topic but this is the one I love the most, especially to start with. I’m also using the same half bridge driver (IR2104) even though I find the 540ns off time somewhat excessive. But I like the enable/pwm input signals as opposed to having to drive each fet individually and I found this feature to be somewhat rare.
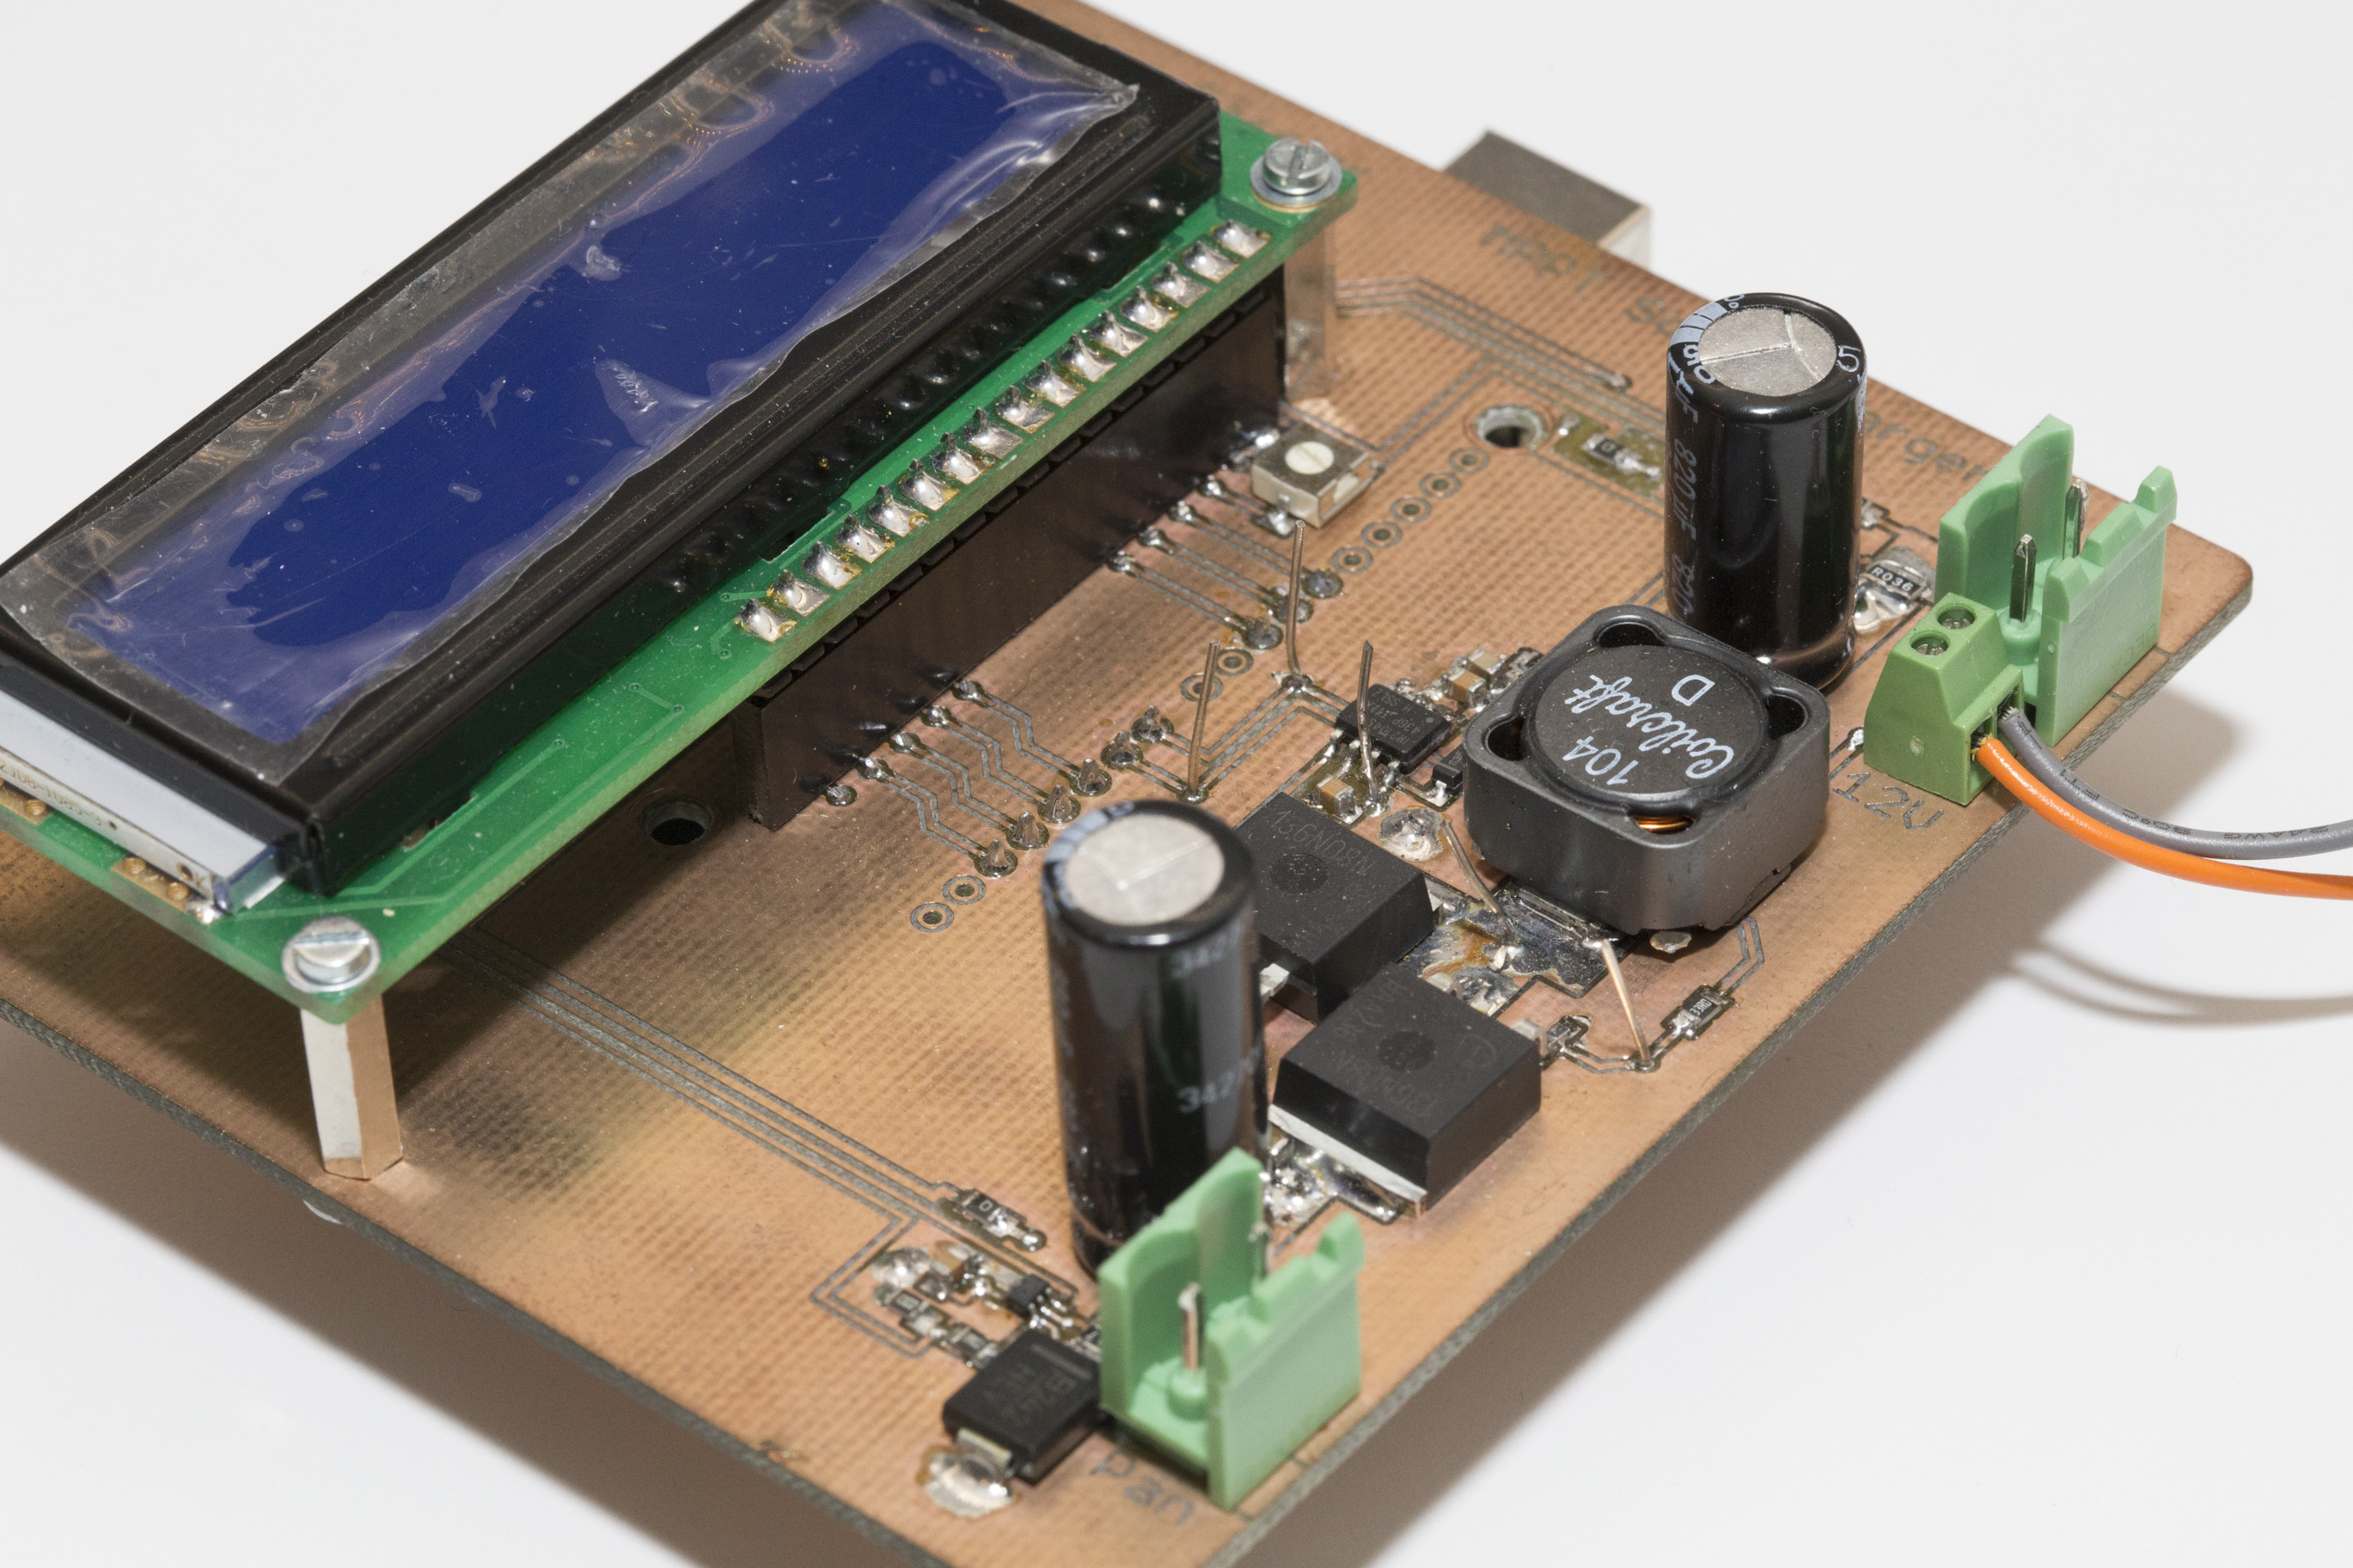
Apart from that I’ve really done my own design, mainly using parts I’ve still had from previous projects. As most stuff I build, it’s entirely SMD, except for the input and output capacitors. Not only are SMS designs smaller in size. The parts are much easier to source (and often cheaper) than conventional through-hole components nowadays. And contrary to popular belief, with a bit of practice I find them easier and faster to solder.
The FETs are IPB136N08N3, a quite large surface-mount type that I use quite frequently. They have a 11mOhms Rds-on resistance which will be great for efficiency. They are also easy to drive in terms of gate capacitance. Probably a bit oversized for the 2.5 amps we’re trying to switch here but I still have some here and they’re not expensive, around 70 cents each. The inductor is a 100uH Coilcraft MSS1583 with a resistance of 0.103 ohms and a 2.8A current rating. 100uH is a bit much at full load, 68uH would easily do. But the system will spend most time at moderate loads (remember, this is not California). I’ve ordered a 68uH as well and intend to use it for a later design or maybe to see what difference it makes. Input and output caps are quite a bit oversized as well, 680uF 35V at the input and 820uH 25V at the output. They are from the Panasonic FR series which I like using for my switchers since they work well at frequencies up to a few hundred kHz while being afordable and having very high ripple current ratings.
I’m doing voltage and current sensing at both input and output. I’ve decided to use conventional high-side, shunt resistor based current sensing. The Texas INA213 are fairly precise, work up to 26 volts and have a fixed gain of 50. Also here, I still had some left over from my dummy load project. Most components are much cheaper if you buy 10 in stead of just one or two so I tend to buy 10 😉
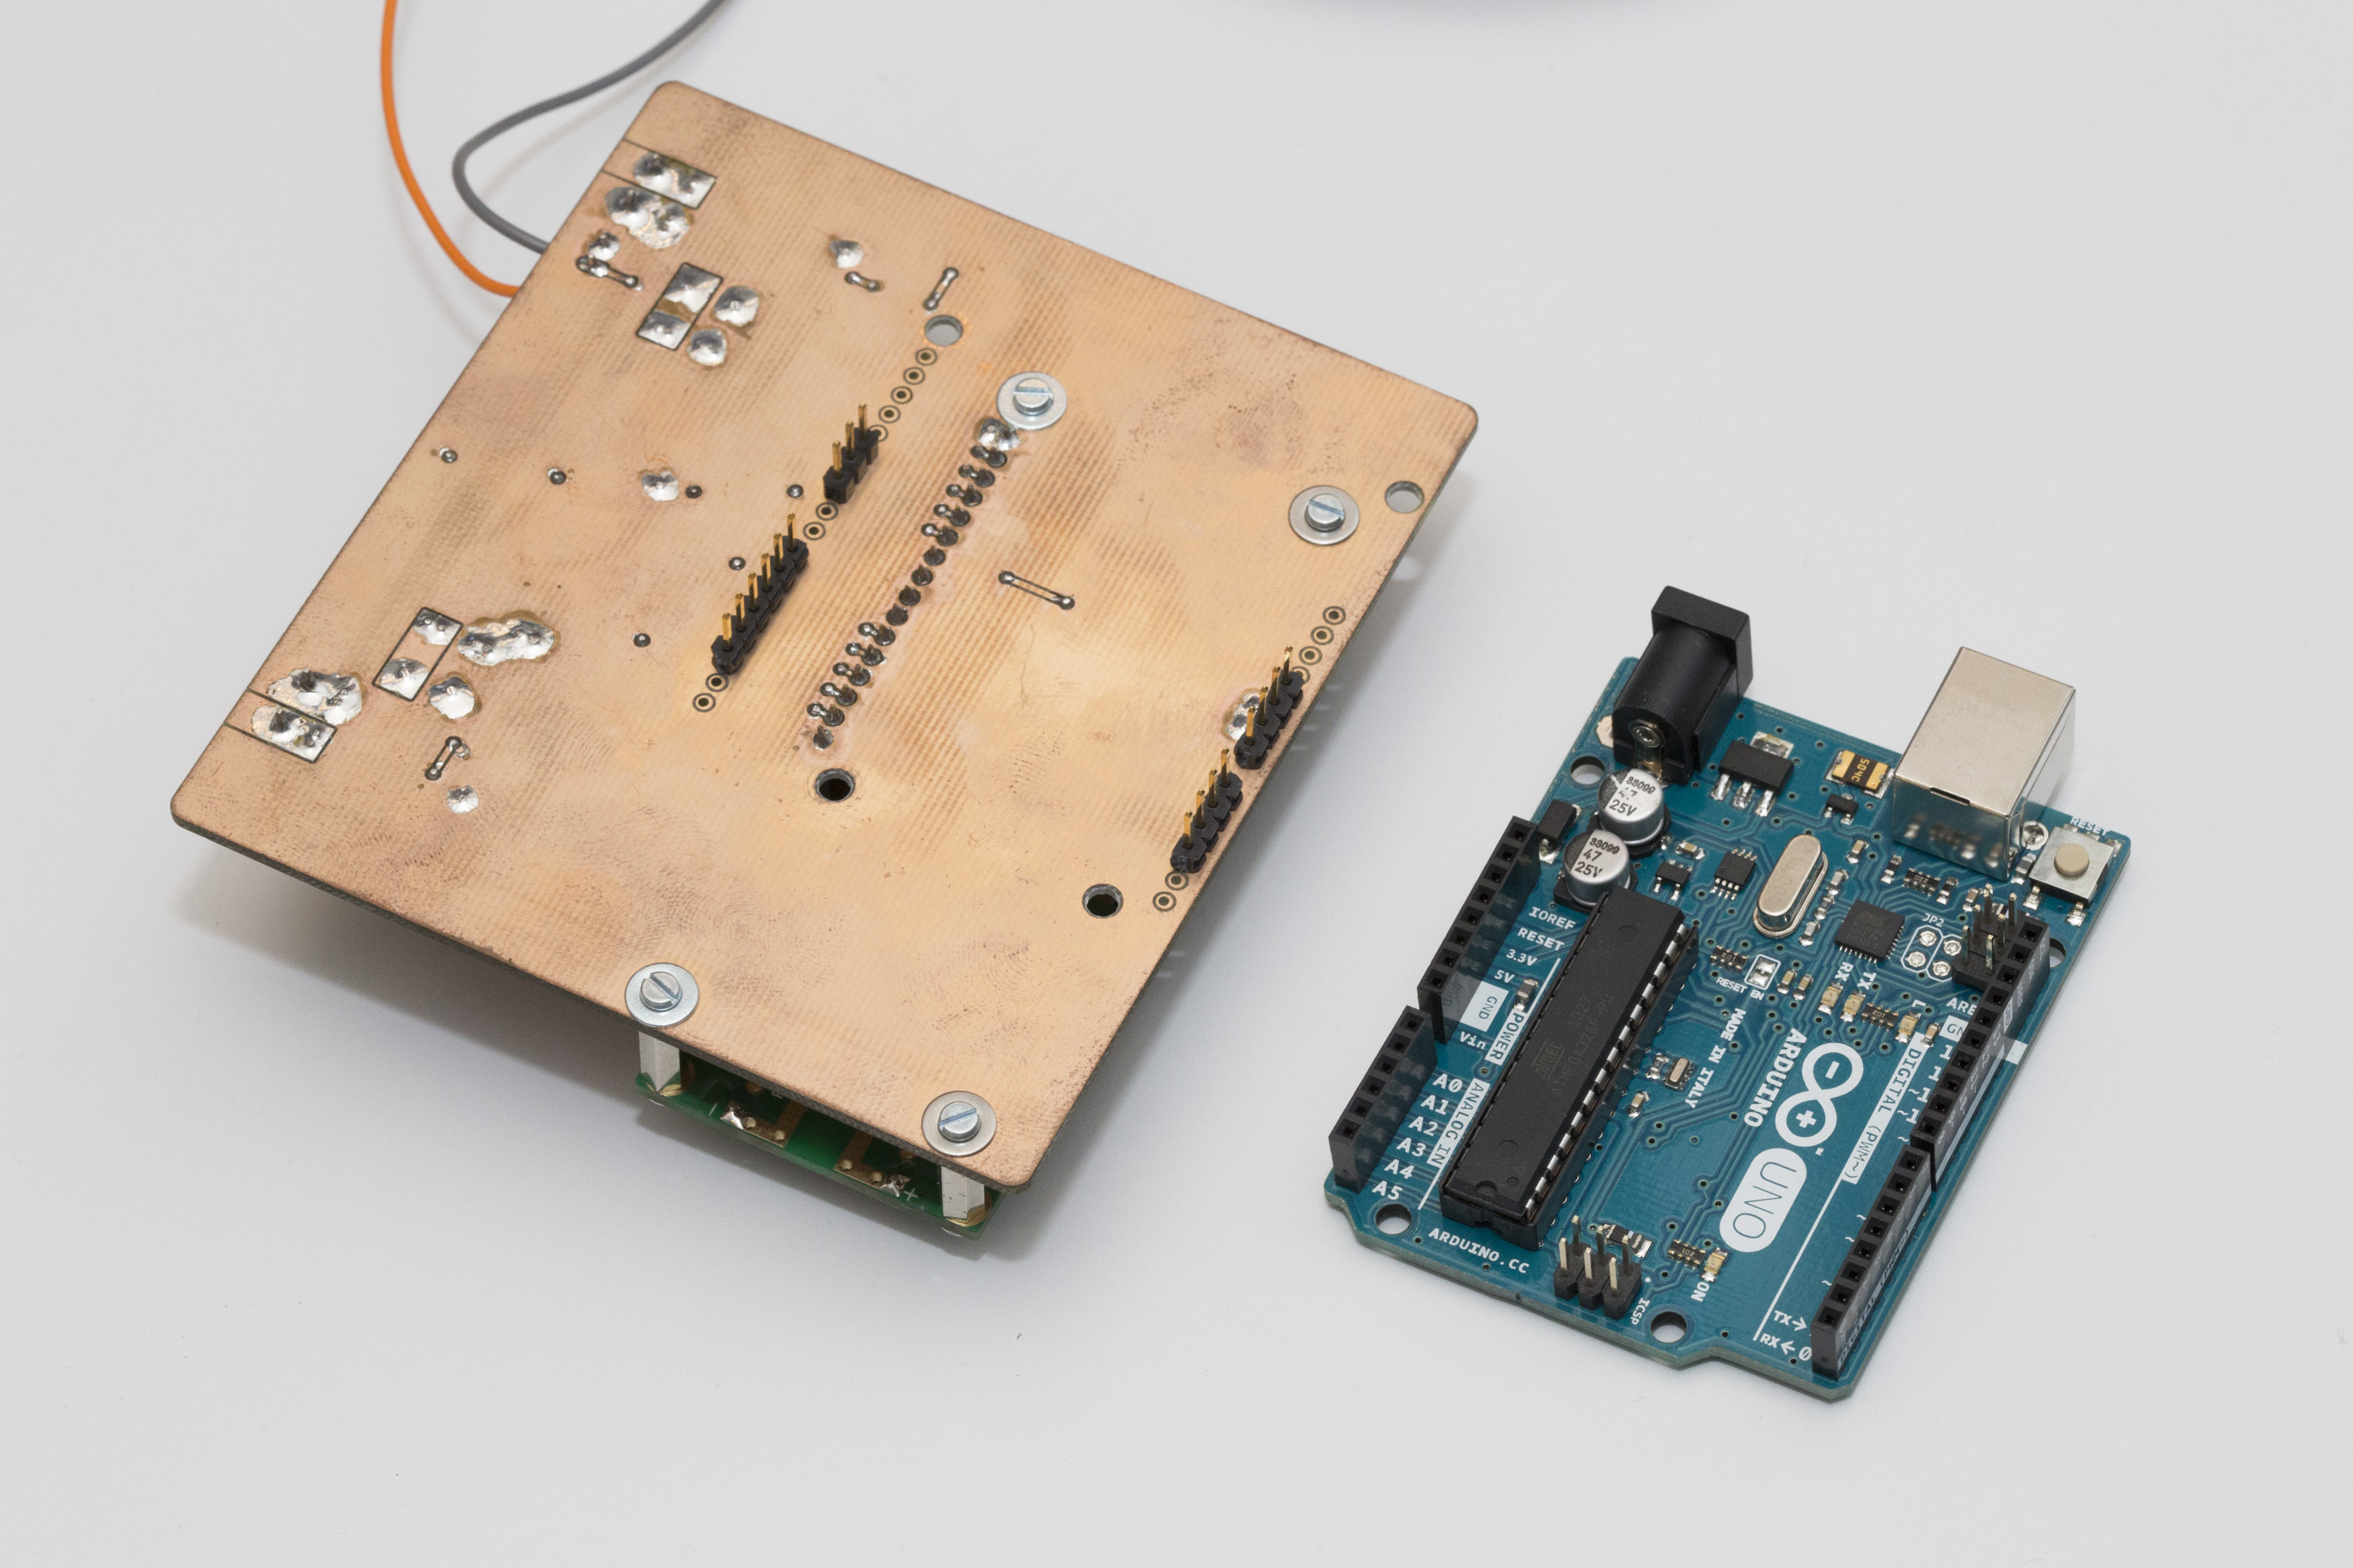
I’ve also added a standard 2×16 characters LCD display so I can see what’s going on. And you may have noticed that I’ve put a zero ohms resistor at several places. This will enable me to easily measure current consumption of the respective sub-circuit. As mentioned before, current consumption will play a major role in the final design so I’m interested to see how much juice is used by certain components under real-life conditions.
Besided the connectors for the panel and the battery, I have added a separate connector for the power supply. This is handy for early testing and programming. Just connecting this supply will power up the entire system. The arduino, the display, the converter and all. But there is not yet any load at the converter’s output and no supply at it’s input. So I can start programming the Arduino, start measuring and displaying voltages and currents and even turn on the converter to see if everything behaves as expected. And since there is nothing at the converter’s input and output, not much can go wrong. I don’t risk blowing up the FETs due to a bug in the program or a problem with the board. Only once I’m confident that everything works as expected I will connect a panel and a battery. At that point, the 12V input can just be connected to the battery as well.
I’ve written a simple sketch for the Arduino that measures voltage and current at the input and output and displays the result on the LCD. Once the input voltage exceeds a certain threshold, it will enable the half bridge driver and start switching. It starts at a duty cycle that will produce an output voltage equal to the current battery voltage. That means that no current will flow to the battery yet so the converter can start up with no load. Once the switcher is turned on, the Arduino will adjust the duty cycle about 4 times a second. If the input voltage is above its optimum and the battery has not yet reached its maximum voltage, the duty cycle will be increased by 1/255. If either the battery voltage is too high or the input voltage is below its optimum, the duty cycle is decreased by 1/255. There are also some checks for overcurrent at the input and output.
The switcher is turned off when the input voltage or the output current falls below a pre-defined threshold. This is a synchronous converter so current can flow back from the battery to the panel. We can’t just wait for the input voltage to fall. As long as the switcher is on, the input will never fall because energy is pumped from the battery to the panel. A synchronous buck converter is just the same as a synchronous boost converter with its inputs and outputs inverted. So we need to make sure current is actually flowing to the battery. Luckily, a car battery will always draw a clearly non-zero current at 13.8 volts, even when fully charged. So when current stops flowing to the battery, we know the panel is no longer able to provide any power and we can or rather must turn the converter off.
This post ist getting rather long so I’ll stop here and will write another post later about how the circuit has been performing and what I have learned so far. I guess this project will turn into a little series, maybe with further (and hopefully improved) versions being developped. Looking forward to that.
Before I forget: Here’s the eagle files as well as schematic and layout PDFs as a zip file: SolarCharger_Rev1.
The arduino-based meter works well and made a great proof-of-concept. But for everyday use you’re probabely not looking for an arduino solution but rather something that looks and feels more like a multimeter. That’s why I’m following up with this stand-alone version.
So this version is battery powered and comes complete with a 3D-printed case. It uses a mid-range PIC microcontroller, a PIC16F1936. Not that there’s much special about this model, I just happened to have some left from previous projects. I also thought about using a Atmel Atmega328, the same chip that is on the Arduino UNO.
Using an entirely different chip means I’ll have to write the software from scratch. But I felt that the Atmega328 was just too much of an overkill just to measure a frequency and control an LCD. They are quite a bit more expensive than the PIC, CHF 3.70 compared to CHF 1.90 @10pieces at Farnell where I get just about all my chips.
Talking of the LCD: The one I’m using here comes with a I2C interface. It’s blue with a white backlight and 2×16 characters and really tiny. I bought 2 of them years ago because they were small and relatively cheap (around 15CHF) and don’t require so many precious I/O pins of your microcontroller. Somehow I never used them but here their small size makes them a good choice. I/O pins aren’t a constraint here obviously as most of the 28 pins are unused.
I’m not yet familiar with the details of how they are controlled. I had a look at the data sheet and it looks like you send them just about the same commands like with the standard Hitachi compatible ones, just over I2C. But I expect to spend an evening or two figuring out the details.
The case was designed using FreeCAD. As the name suggest, it’s a free (and open-source) CAD design tool. This was only the second time I was using it but I found it quite easy to learn.
I printed the case at the Zürich fab lab (zurich.fablab.ch) on one of their Ultimakers. Was my first 3D-printing project, thank you very much for your support, everyone.
As always, I’ll put all the files online as a zip. So you can download all the Eagles plus PDFs as well as the FreeCAD models. Here it is: InductanceMeter. I haven’t written any software yet but I’ll but that online, too, as soon as it’s finished.
It’s been a while since the last post of this series. As so often, the task turned out to be more demanding than I first thought. And then I was also entirely new to assembly language, got distracted by my Inductance Meter Project (https://soldernerd.com/2014/12/14/arduino-based-inductance-meter/) and went on a skiing holiday. But finally, the promised library is ready.
If you’re new to my Arduino-based ultrasonic wind meter project, you might want to click here for an overview: https://soldernerd.com/arduino-ultrasonic-anemometer/. This is also where you find all the various downloads, including the new library.
I’ll go through the meaning and usage of these one by one:
anemometerSetup()
This function has to be called once before the anemometer can be used:
void setup() { anemometerSetup(); }
anemometerStatus
anemometerStatus notifies your when a new set of measurements has been completed and is ready to use. Every time a new set is ready, anemometerStatus will be set to 1. You have to set it back to 0 once you’re done with your calculations.
if(anemometerStatus==1) { /* use the results */ anemometerStatus = 0; }
A new set of results is made available exactly every 250ms or 4 times a second.
anemometerCalculationSet
anemometerCalculationSet is a pointer to the ready-to-use results.
Internally, the library uses a ping-pong buffer. Every time a new set of results becomes available, anemometerCalculationSet is updated to point to the last completed set of results.
The result set pointed to by anemometerCalculationSet is a
This is easy to understand. It is the time it takes for the envelope detector to trigger. It is averaged over 32 measurements. Reference point is the rising edge of the first pulse sent. The unit is nanoseconds (ns).
Time of flight explained graphically
sine, cosine
sine and cosine indicate the phase shift between the transmitted and the received signal.
This was by far the most challenging part of library. For each of the 32 measurements, 4 rising and 4 falling edged of the zero-crossing detector are evaluated. So the phase shift indicated by sine and cosine is an average over 256 measurements. But phase shifts wrap around, casually speaking. A phase shift of 359 degrees is almost the same as phase shift of 1 degree. The average should be zero degrees, not 180. Now you could try to solve the problem by constraining your phase shift to the range of -180 to +180 degrees. But that only moves the problem to the other side of the circle: -179 and +179 degrees are almost the same and their average should be 180 degrees, not zero.
I spent quite some time thinking about this and came up with increasingly complex alogrithms that still failed when some unlucky combination of angles was encountered. Remember, we are trying to average n (currently n=256) angles, not only 2.
But of course, many people smarter than me have encountered the problem before and have come up with a perfectly elegant solution: If phi is your phase shift, then calculate sine(phi) and cosine(phi). Sum up all the sines and all the cosines. Then use the arctangent function to convert the summed sines and cosines back to an (averaged) angle. [If wordpress had something like LATEX support, one could state this as a nice-looking formula]
So there is an elegant solution. But there’s also a tight time budget: The zero-crossing detector triggeres every 12.5 microseconds (us). In order to not miss the next zero crossing, we need to calculate both sine and cosine and add them to their respective sum in less time than that. And then there is some overhead like context switching. Plus we also have to do some housekeeping during that time.
sine and cosine are expensive functions, even more so on a 8bit microcontroller. So the only way was using a lookup table. With this approach I managed to stay within budget (around 10.8us). Besides, missing the next edge is not the end of the world – the edge after that is almost as good.
Zero-crossing interrupts are just fast enough not to miss the next edge
So we now have summed sine and cosine values – how do we use them?
atan2(cosine, .sine) gives you the phase shift in radians. Multiply this by (180/PI) if you prefer degrees. My preferred approach is:
(12500.0/PI) * atan2(cosine, sine)
This also gives you the phase shift but with nanoseconds (ns) as unit which makes it directly comparable to the timeOfFlight which is also in ns.
temperature()
There’s also another function returning the temperature. It returns a int16_t containing the temperature in 0.01 degrees centigrade. So if the temperature is 23.45 degrees, it will return 2345.
It’s currently implemented using floating-point math and does not account for the sensor’s (slightly) non-linear nature. It’s there mainly as a placeholder. I’m planning to implement it properly using a lookup-table with interpolation which will make it much faster and will allow it to include the non-linear effects.
Arduino Sketch
The .zip file with the library also includes a very basic arduino sketch using that library. I’m still evaluating what is the best way to calculate the actual wind speed and direction taking into account issues such as calibration and the like.
But my preliminary results look quite promising and I’m confident that most if not all the heavy lifting has been done.

 Recently, I’ve sucessfully tested the new driver ciruit for my ultrasonic anemometer. It performed even better than I expected and I will be happy to use it pretty much as it is.